
The feasibility of establishing a Basic Income Grant in South Africa (Part 2)
- Mar 8, 2023
- 47 min read
Updated: Apr 11, 2024
Chapter 4: The performance of social protection programmes (SPPs)
Performance indicators serve as important guidelines for determining progress with development objectives in the domain of combating poverty via public welfare initiatives. Governments invest significant resources in the implementation of social protection programmes (SPPs), which necessitates the continuous monitoring of the effectiveness of these programmes and to also inform the future direction of social policies.
Two mainstream methodologies are utilised to assess the performances of the variety of SPPs that are implemented in virtually all of the world’s developing countries. Performance indicators derived from household surveys assess the distributional effects of the social transfers on the welfare of beneficiaries, as well as their effect on disposable incomes and the combating of poverty. A second method relates to macroeconomic impact assessments, which are usually designed to measure a broader set of economic outcomes, such as the effects on the level of consumption, production, labour supply, human capital formation, and the stability of the public finances (especially taxation revenues, government debt and capital market interest rates).
The focus of this section is on the impact of SPPs in the quest to alleviate poverty and income inequality. It commences with an overview of comprehensive global research on social protection in developing countries conducted by the Universal Social Protection (USP) initiative. This is followed by concise overviews of SPP impact assessments in the Southern African Customs Union (SACU) countries and two studies on South Africa by local researchers.
Progress with combating poverty in developing countries
In 2016, the World Bank Group, the International Labour Organisation (ILO) and various bilateral and multilateral partners launched the USP initiative with the objective to support the Sustainable Development Goal (SDG) agenda for social protection. The USP partners have subsequently expanded and refined the research and analysis required for monitoring progress with combating poverty and inequality in developing countries around the globe, using a variety of performance indicators.
Key indicators and data sets
A selection of key indicators that are commonly used to measure progress with SPPs provides the basis for this analysis, which draws heavily on World Bank research conducted under the USP initiative. The indicators selected are: coverage, the reduction of the poverty headcount, benefit incidence and adequacy. They are defined as follows:
Coverage
The percentage of the population participating in social protection programmes - SPPs (includes direct and indirect beneficiaries). This indicator is reported for the poorest quintile of the post-transfer welfare distribution. Specifically the indicator is computed as: The number of individuals in the bottom quintile who live in a household where at least one member receives the transfer divided by the number of individuals in that quintile.
Poverty headcount reduction
Poverty headcount reduction is estimated as: Poverty headcount pre-transfer minus poverty headcount post-transfer, divided by poverty headcount pre-transfer
Benefit incidence
Percentage of benefits received by the poorest quintile of the post-transfer welfare distribution, relative to the total benefits going to the population. Specifically, benefit incidence is computed as: The sum of all transfers received by all individuals in the bottom quintile divided by the sum of all transfers received by all individuals in the population. The indicator includes both direct and indirect beneficiaries.
Adequacy
The total transfer amount received by all beneficiaries in the bottom quintile as a share of the total welfare of beneficiaries in that quintile (includes both direct and indirect beneficiaries).
Public spending
The total value of government spending on SPPs (excluding administrative costs0, expressed as a percentage of GDP
Household surveys play a crucial role in monitoring programmes, given that they are systematically conducted on a time-series basis and the performance indicators gleaned from them complement the results of impact assessments in determining the achievements of social protection programmes. The analysis is based on subsets of household surveys (2008–20) from the Atlas of Social Protection: Indicators of Resilience and Equity (ASPIRE) database, corresponding to 96 countries with information about SSPs, supplemented by demographic data from the United Nations and the South African National Treasury.
Voluminous research has been conducted on the impact of an array of programmes aimed at poverty reduction, especially via social safety nets. Programmes aimed at enhancing social security may include cash transfers, in-kind transfers, social pensions, public works, and school feeding programs. A key finding of the latest State of Social Safety Nets Report (World Bank: 2018) is that even if many do not emerge from poverty, the absence of these programs would have caused many people to fall in to poverty and others to fall into deeper poverty, often being forced to sell their assets or borrow more. Another key finding that is relevant to the South African discourse on welfare policy, is that social welfare programmes also tend to lower inequality.
According to the World Bank’s ASPIRE household survey database, a total of 144 developing countries have social safety programmes in place. Table 4.1.depicts the numbers of developing countries that are implementing some form of social protection programmes (the administrative totals) and the numbers of countries for which more detailed datasets are available through household surveys.

In order to facilitate analysis, the Aspire database groups SSPs into standard categories, which aggregate different programme types. This means that the coverage indicator corresponds to the aggregated programme category and not necessarily to an individual program. For example, Latvia includes 10 programmes under unconditional cash transfers (UCTs), whilst Belize includes only one programme (the social welfare transfer). It is clear from the list contained in tables 4.2 and 4.3 that a large variety of individual categories of SPPs are being employed by developing countries, although they share the characteristic of being non-contributory. The social policy objectives of each country determines the choice of particular programmes within the broad classification identified earlier in section 2.


General observations from the performance of seven key categories of SPPs analysed in the World Bank’s 2018 report on the state of social safety nets are:
The average beneficiary incidence of the 19 CCT programmes included in the ASPIRE database was 45% for the poorest quintile. In general, Conditional Cash Transfers (CCTs) are more effective in poverty alleviation than other SPP types. CCTs were pioneered by Brazil and Mexico towards the end of the 2nd millennium and have become popular in most other developing countries. These programmes aim to reduce poverty in a multi-dimensional manner by requiring beneficiaries to comply with conditions aligned to enhancing human capital, usually linked to school attendance and health check-ups.
Although UCTs are characterised by a wide range of beneficiary incidence across countries, 37 percent of UCT beneficiaries, on average, belong to the poorest quintile. One reason for this large variation is related to the aggregation of many types of UCTs in the World Bank database, as well as different objectives and eligibility criteria in the respective country programmes. It is important to note that universal programs tend to exhibit an even distribution. An example is the Child Money Programme in Mongolia, where the participation of all five quintiles is close to 20 percent. In contrast, the programmes in Kosovo and Montenegro are much more focused on the poorest quintile, which accounts for more than 70 percent of the total UCT beneficiaries.
Social pensions also have a substantial pro-poor distribution of beneficiaries with an average of 35 percent of beneficiaries belonging to the poorest quintile. There are, however, large variances in the performances amongst different countries, depending largely on the manner in which the pre-transfer indicator is constructed. For example, it social pensions have a high coverage and high benefit level of the poor, beneficiaries may tend to depend on them and hence group in the lowest quintile of the pre-transfer welfare distribution.
Beneficiary incidence of school feeding programs are in the same range as the remaining three indicators (in-kind transfers, public works and targeted subsidies), namely 34% for the bottom quintile. A large degree of variation exists between countries, with the most pro-poor programmes found in the Slovak Republic and Latvia, where 82 and 73 percent of the beneficiaries are from the poorest quintile, respectively.
In-kind transfers generally also benefit poorer households quite pro-poor. In the World Bank’s sample of observed programs, 34 percent of beneficiaries of in-kind transfers belong to the poorest quintile, with food aid in Djibouti and Uruguay both having a beneficiary incidence of above 70%.
The beneficiary incidence of public works programmes for the poorest quintile is 33%, on average. When the second poorest income quintile is added, the beneficiary incidence rate remains at higher than parity, which still classifies public works as a pro-poor instrument. The reasons for this category trailing CCTs is related to the fact that most public works are limited to people who are able-bodied, unemployed and willing to work. Because these programmes are usually over-subscribed (the demand for employment positions exceeds the supply), people in higher income quintiles may also benefit from them.
On average, fee waivers and targeted subsidies have a similar beneficiary incidence than for public works, with 33 percent of their beneficiaries belonging to the poorest quintile. Examples of these types of SPPs include food supplements, tuition fee waivers and the subsidisation of housing, petroleum, kerosene and agricultural inputs.
The beneficiary incidence analysis conducted by the different types of social protection instruments reveals that, on average, all types of programmes tend to be pro-poor (in terms of a higher percentage of beneficiaries belong to the first and second poorest quintiles). This conclusion also holds for the analysis across countries, which shows the presence of highly pro-poor programs in each program category, despite variations in beneficiary distribution across countries.
Performance indicators for upper-middle income countries
Although SPP transfer levels vary greatly across the different types and across countries, World Bank research indicates that such transfers account for 19 percent of the welfare of the poorest quintile, which confirms their meaningful impact on poverty reduction. Differences in impacts reflect, in part, different program objectives and the degree of transfer values captured in household surveys. For the total population, SPP benefits as share of beneficiary welfare is 7 percent for high-income countries, whereas for low-income countries and upper-middle-income countries it is 11 percent and for lower-middle income countries it is 9%.
Due to this relatively small variance in the shares of SPP impacts on beneficiary welfare in the different country income groups and the relevance of like-for-like comparison, the focus of the following analysis will be on the upper-middle income group of developing countries, of which South Africa is a member. A total of 30 countries for which sufficient and recent data are available have been included. It should be noted that the averages have been determined by a weighting exercise, based on the size of the populations. These 30 countries are ranked in terms of their performances against the four key indicators identified earlier, namely coverage, the reduction of the poverty headcount, benefit incidence and adequacy, as well as a fifth indicator, namely government expenditure on SPPs as a percentage of GDP.
i) Coverage
It is clear from the data in table 4.4 that South Africa is the standout performer amongst its peers for the coverage of SSPs.

It should be noted that World Bank data for South Africa has been updated with the addition of the Social Relief of Distress (SRD) grant, commonly referred to as the Covid grant, which has raised the coverage level, but only marginally so. When comparing the most recent data in table 4.4 with the earlier World Bank report on social security nets (2018), it is also clear that most countries have been able to expand their coverage between 2014 and 2018. Reasons for the coverage indicators being particularly high include the following:
The figures are based on the full spectrum of social protection measures, not merely safety nets. They include old-age pensions, labour market interventions, cash transfers, public works, school feeding schemes and targeted subsidies.
The calculation includes direct and indirect beneficiaries
Pre-transfer welfare is utilised in the estimation of the poorest quintile. South Africa’s sterling performance with regard to the coverage of SPPs is particularly impressive when juxtaposed with the global average for developing countries of 56% (as determined in the 2018 World Bank study). It is also worth noting that even if the high-income group was included in the above analysis, South Africa would still be ranked first.
This performance proves that South Africa’s social welfare policies are exceptionally comprehensive and suggests that further refinements to social protection should concentrate on the level of the benefits and also the introduction of conditionality, especially in the area of human capital development and consideration of an income grant for unemployed people.
Another indicator associated with coverage of SPPs (and the prevalence of poverty) is the percentage of the population that receives cash grants, where South Africa is ranked second best amongst developing countries (illustrated by Table 4.5)

ii) Poverty headcount reduction
Over the past quarter of a century, the ability of social assistance to reduce poverty and inequality has been subjected to substantial research, most notably by the World Bank Group and its partners. The methodology employed in such exercises includes a comparison of the welfare position of beneficiaries before and after SPP transfers.
On the basis of the information observed in household surveys, the most recent comprehensive analysis by the World Bank (2018) shows that SPP transfers are making a substantial contribution in combating poverty. This finding holds for both an absolute poverty line as benchmark and a relative poverty line (measured in terms of the poorest quintile of the population). It is encouraging that individuals are escaping poverty or decreasing their depth of poverty because of social welfare policies. For the 79 countries with sufficient monetary information that were surveyed in the 2018 World Bank study, transfers reduced the incidence of absolute poverty (US$1.90 at PPP per day) by 36%, whereas relative poverty (the bottom 20 percent) was reduced by 8% (on average).
On average, SPP transfers have reducing the poverty gap more than the poverty headcount. According to the analysis in the 2018 World Bank study, transfers reduced the absolute poverty gap by 45% and the relative poverty gap by 16%. At the time, these results were described by the authors of the study as “remarkable”, considering that these figures were underestimated because household surveys (upon which the study was based) do not capture the whole universe of SPPs implemented in developing countries. Therefore, it can be inferred that the real impacts were likely to be even larger.
These comments turned out to rather prophetic, as subsequent updating of the World Bank’s ASPIRE database has confirmed a fairly dramatic improvement in the reduction of the poverty headcount amongst all countries surveyed. In the 2018 study, the average reduction in relative poverty headcount was only 2% in low-income countries, 7% in lower-middle-income countries, 11% in upper-middle-income countries (South Africa’s group), and 15% in high-income countries.

Table 4.6 depicts the results of an updated analysis conducted for the purposes of this impact assessment, utilising the ASPIRE database. It should be noted that the 2020 figure for South Africa has been estimated by applying the average increase in the poverty headcount reduction between the 2018 World Bank study and the updated data, as at July 2022. The average elapsed period between these two data sets was 4.6 years. As was the case in the previous analysis, South Africa is ranked first amongst its peers in the upper-middle income countries.
The pace of progress with reducing poverty over the past decade provides a measure of credence to the ambitious ideals of the very first of the Sustainable Development Goals adopted by the United Nations in September 2015, namely to: “End poverty in all its forms everywhere”.
Viewed from the perspective of the slow progress with reducing the poverty headcount in low-income countries, it is clear that this group will require special attention, especially with regard to the lack of the fiscal resources required for cash transfers to the poor and vulnerable. Caveats do exist, however, that serve to explain, to some extent, the lower reduction in poverty and inequality observed for low-income countries. According to the World Bank (2018), this trend is likely driven by the following factors:
Fewer low-income countries have recent household survey data available compared with other country income groups.
Of the 22 low-income country surveys included in ASPIRE, only 14 surveys include monetary variables for SPPs.
Many low-income country surveys neither capture SPP-specific information nor include the universe of programmes that exist in the country.
Less than 10 percent of the global population live in low-income countries; therefore, the number of individuals moving out of poverty (in percentage terms) is lower than in other country income groups.
iii) Benefit incidence
Benefit incidence represents one of a group of metrics widely used to determine the extent to which SPP transfers are distributed amongst different income groups. The denominator of the relevant calculation is based on the sum of all transfers received by all individuals in the population, which introduces an element of bias in this indicator’s accuracy for determining progress with poverty alleviation.
If social assistance transfers are adequate enough to lift a significant proportion of people out of the bottom quintile, a relatively low reading for the benefit incidence should not be a cause for undue concern. As long as the benefit incidence is above the 20% neutral level, it still reflects a pro-poor outcome.
It is not always possible to draw general conclusions about the distribution of beneficiaries and benefits of a specific program without knowing detailed information on the program’s design, eligibility criteria, and implementation. Drawing on research by Seldon & Wasylenko (1992) and the World Bank (2018), specific caveats to be considered in the analysis of benefit incidence include the following:
Some programs may not be pro-poor by design; for example, they may not be targeted specifically to the poor but to the general population, especially in the case of universal programs.
The eligibility criteria of some programmes may be categorical (for example, in terms of disability) and not means-tested. In such cases, beneficiaries meeting the categorical requirements may not belong to the poor.
The pro-poor performance based on benefit incidence is influenced by the way in which the pre-transfer indicator is constructed. If social pensions cover a sizable part of the poor and their benefit and dependency levels are high, there will be a trend for most beneficiaries to group in the lowest quintile of the welfare distribution once such transfers are removed, and vice versa.

The methodology for measuring household benefits does not fully consider important issues such as the possibility of benefits being shifted and marginal benefits differing from average benefits.
Some benefits from physical capital expenditure and human capital investment may accrue to households over more than one time period
In the final instance, data on benefit incidence need to be considered in conjunction with other key performance indicators, especially coverage, adequacy and whether the absolute value of welfare benefits is reducing the poverty gap.
Table 4.7: Indicates that South Africa’s ranking for benefit incidence amongst its peers in the upper-middle income countries is lower than for the other performance indicators reviewed, but remains classified as pro-poor (above 20%, according to the World Bank norm).
iv) Adequacy
South Africa’s exceptionally high ranking for most of the key indicators that determine a country’s performance in the area of social assistance is also prevalent for adequacy, which is calculated as follows: The amount of transfers receives by a quintile divided by the total income or consumption of beneficiaries in that quintile. In terms of the latest reference year documented in the ASPIRE database, South Africa enjoys a score of above parity, which could be explained by an under-estimation of the income/expenditure of the bottom quintile (the divisor), as the data on the transfer amounts are verifiable (the dividend).

According to the World Bank’s most recent detailed report on social protection in South Africa, the country’s adequacy ratio is marginally less than parity (100% - see table 4.8), which secures the number one ranking within the peer group of middle-income developing countries and also within all developing countries.
The World Bank’s reference (2021) to the “small value” of grants in South Africa is not consistent with the evidence, as confirmed by the fact that in the earlier World Bank study on social safety nets (2018) South Africa’s disability grant was ranked the fourth highest out of a selection of different types of grant transfers from 36 countries. Whilst the SRD grant and child support grant are substantially lower than the social pension and the disability grant, South Africa still has one of the highest levels of annual per capita spending on SPPs, as depicted by table 4.9.
At a level of $575 (2020 purchasing power parity – PPP, South Africa’s annual per capita public spending on SPPs is 52.6% higher than the average for the countries listed in the table. Although the comparison should take cognisance of the differences in reference years, it is clear that South Africa passes the adequacy test with flying colours.
It is nevertheless clear from the definition of the adequacy indicator that the prevalence of a significant degree of poverty will tend to be correlated with a relatively high adequacy level.
The average annual transfer per capita for beneficiaries of the South African grant system in 2020/21 is estimated to have been R7,837 for all grants, and R10,814 without the SRD grant (which remains a temporary arrangement). Compared to the per capita household expenditure of beneficiaries, this amount is highly significant. Averaged across all beneficiary households, the World Bank (2021) estimates grant income to be equivalent to roughly 25% of per capita household expenditure.

This is aligned to the 2021 General Household Survey conducted by Statistics South Africa, which found that grants constitute 24.4% of total household income – a high percentage by international standards. For Sub-Saharan Africa, the ratio of social assistance transfers to the household expenditures of beneficiaries is 19.4 percent and for all the upper-middle income countries it is only 5.6 percent.
Although this figure is as high as two-thirds for beneficiary households in quintile 1 and 40 percent for beneficiary households in quintile 2, overall, per capita social assistance transfers in South Africa are higher than most other developing economies.
v) Government spending
As is the case with all of the above SPP performance indicators, the data in table 4.10 confirms that South Africa also enjoys an exceptionally high ranking for the total fiscal value of social welfare programmes. The South African government spends 4.3% of GDP on social protection, which is the second highest for the group of middle-income developing countries and three time more than the population-weighted average.
When the total government expenditure on social protection for the 2020 calendar year (as per the National Treasury’s 2022 Budget Review) is used as the basis for the SPP spending as percentage of GDP, the per capita spend determined in table 4.9 rises to $893 and the figure in table 4.10 Rises to 6.6%, both of which would propel South Africa to the highest ranked country for these two performance indicators.
Due to the inclusion of administrative expenditure in the national budget figures, however, only the cash value of grants has been included in the above analysis (grants constitute 89% of government expenditure on social protection).

The overriding importance afforded to social protection in South Africa is also reflected in its dominant position vis-à-vis other budget votes, as illustrated by figure 4.1. In the 2020/21 National Budget, social protection commanded 21.8% of total non-interest expenditure of the country’s public expenditure (consolidated national and provincial government and social security funds). By any relevant metric, as amply illustrated by the results of these key performance indicators, South Africa’s social assistance system represents a major intervention by government in addressing poverty. As duly acknowledge by various research studies, including those of the World Bank (2018 & 2021), the South African system of SPPs is extensive in terms of both the number of people it covers, directly and indirectly, and the amount of fiscal resources required for its funding.

After the introduction of the SRD grant in 2020, almost half of South Africa’s population are direct beneficiaries of a social grant, while an estimated 77% of the population are either direct or indirect beneficiaries of the system.
Comparison – global regions and income groups
The data presented in this study clearly demonstrates the exemplary performance of South Africa in addressing poverty and inequality with appropriate social protection measures. Social transfers have been at the forefront of these policies, having reduced the poverty gap by more than 73% (World Bank 2021).

This is a substantially larger impact than is observed for any of the country groupings (see figure 4.2). South Africa’s social assistance system has proven to be highly effective in providing support to the poorest segments of the population, especially via social grants that provide financial resources to poor households which reduces the depth of poverty and inequality. Vulnerability is also reduced via the provision of regular and dependable income. Apart from the grant system, poverty reduction is also facilitated by the positive effects of other public expenditures in the areas of health, education, school feeding, public works and fee waivers.
The World Bank has commended South Africa for the existence of modern administrative delivery systems used for administering social grants. All social grants (except the foster child grant) are means tested in different ways using the national ID number and income or assets as a basis and comparing the documentation of applicants against national databases. As is the case in most developing countries, all direct transfers in South Africa are classified as pro-poor and the country stands out for the progressivity of its transfers—it has the most progressive grants for foster care, people with disabilities and old age pensions, whilst the World Bank (2022) has commended South Africa for the significant impact of the child support grant on reducing inequality.
Some concerns
Various studies on the state of social safety nets in South Africa, including evaluations of the criteria for the approval of grant applications by the Department of Social Development (DSD), have nevertheless pointed out a number of shortcomings of the social protection system, as well as suggestions for improving the design of SPPs. These include the following:
The absence of a social grant that is accessible to working-age adults and which is not predicated on disability. Although the SRD grant has filled this void, its level of support is only 56.1% of the 2021 Food Poverty Level (FPL) and its remains a temporary policy measure introduced as a result of the additional hardship inflicted by the Covid pandemic on many poor people. Due to a large degree of fiscal leeway that occurred in the wake of a strong upward phase of the commodity cycle for metals and minerals during 2021, South Africa’s National Treasury was in the fortuitous position to extend the SRD grant for the fiscal cycle ending on 31 March 2023, but uncertainty prevails over the future of this grant. If the SRD grant is removed without a suitable alternative to cater for the millions of unemployed people who have received this benefit, much of the gains from the social protection system will have been lost
Insufficient conditionality exists in the grant system, especially with regard to requiring beneficiaries to become involved with public works programmes and the enhancement of human capital. Many examples exist in other developing countries of SPPs that have been successful in raising school attendance levels, health check-ups at clinics and skills development via workfare programmes.
In July 2022, the DSD announced its concern over the low number of approvals for the SRD grant. Out of 11.4 million applicants for the month of June, only 5.2 million beneficiaries were approved, representing only 45.6% of the applications. As a result, the DSD intends to increase the allowable income threshold from R350 to the food poverty line of R624, meaning that the South African Social Security Agency (SASSA) will decline any applicant who receives more than R624 into their bank account for each relevant month. The value of the grant itself remains R350 per person per month for the period 1 April 2022 to 31 March 2023. Although South Africa’s performance in terms of the poverty-reducing impact of social assistance is outstanding, the value-for-money performance is disappointing and suggests that the costs of South Africa’s system are relatively high compared to other countries. Estimates of the benefit-cost ratio for social assistance in South Africa reveal that, while the country is on par with the average for upper-middle income countries, its performance is 17% weaker than the average for countries in Latin America and the Caribbean. In conclusion, it should be noted that the World Bank has identified an improved understanding and assessment of the cost structures and cost drivers associated with administering social assistance in South Africa as an area for future research (2021).
Chapter 5: Country case study no. 1: Brazil
Introduction
Brazil’s social welfare programme has proven to be successful to the point of widely being regarded as a role model for the combating of poverty in developing countries and emerging markets alike. In the context of the current debate on establishing a permanent income grant in South Africa, it is regarded as highly relevant to consider salient aspects of Brazil’s Bolsa Família cash transfer programme (BFP), which was amended in December 2021 and renamed Auxilio Brasil.
Origins
The conditions for implementing fiscally sustainable welfare policies in Brazil started to fall into place after the peaceful transition from 20 years of military rule to the so-called re-democratisation of Brazil in 1985 and the writing of a new constitution, adopted in 1988.
Fernando Henrique Cardoso, a former Secretary of the Treasury, became president in 1994, winning the election by a very comfortable margin against his eventual successor, Luis Inácio "Lula" da Silva, leader of the Workers’ Party. Four years later, he won a second term almost as easily, taking 53% of the vote to Lula da Silva's 31.7%. To date, he is the only president to win an outright majority of the popular vote since democratic elections were reinstated in 1989.
Cardoso’s presidency saw institutional advancements in human rights and he was the first Brazilian President to address the large measure of inequality in the country. Under his leadership, four comprehensive welfare programmes were established that were ultimately consolidated into the Bolsa Família by Lula da Silva. Several authoritative historians and political economists, including Timothy Power, Marcus Melo and Carlos Pereira, primarily credit Mr Cardoso for getting the necessary sequencing right in the design of welfare policies: economic stabilisation and state reform had to come first, followed by an attack on poverty and inequality, which was ultimately refined and consolidated by the Lula government.
The roots of the CCT model in Brazil were established in 1995, as an innovative anti-poverty intervention by a number of municipalities in low-income regions that required education-related conditions to be met by the beneficiaries. In 1997, Cardoso convinced the Federal government to assist with the funding of these social programs. In 2001 it was expanded and renamed “Bolsa Escola” and soon after, the government initiated a program named “Bolsa Alimentação” which was a cash transfer program that required health conditions to be met by the beneficiaries. Another programme followed in the same year, namely Auxílio Gás. The latter was an unconditional cash transfer (UCT) involving a subsidy for the purchase of cooking gas by poor households.
Amalgamation
In 2003, under the new presidency of Lula da Silva, Bolsa Família was created to overcome the conceptual and operational fragmentation of numerous federal cash transfer programmes. It is estimated to have reached over 20 per cent of the Brazilian population and has achieved significant positive results in the quest to alleviate poverty, as detailed in the following sub-section. The BFP was not an immediate success, however, due to perceived shortcomings in its implementation, which led to fierce criticism from all quarters. Within a year of its adoption as an amalgamation of existing cash transfer programmes, the BFP was facing a crisis of legitimacy threatening to turn it into a political liability for the federal government.
The programme’s administration was improved post haste (inter alia with the assistance of the World Bank) and, together with various positive assessments from independent impact studies turned the tide of public opinion around fairly quickly.
Over the past two decades, Brazil’s Bolsa Família programme (BFP) has become synonymous with Latin America’s progress in combating poverty via conditional cash transfers (CCTs). The Economist has described the BFP as an “anti-poverty scheme invented in Latin America [which] is winning converts worldwide”. In 2020, the program covered 13.8 million families, and paid an average of R$34 per month, in a country where the minimum wage is R$190 per month. It was a key element of former President Luiz Inácio (“Lula”) da Silva's social policies and is reputed to have played a role in his second electoral victory of 2006.
According to Robles & Mirosevic (2013), two main landmarks for the eventual success of non-contributory social protection in Brazil were, on the one hand, the fact that legislation was introduced in order to support social programmes and their articulation; and, on the other hand, the creation of an entity in charge of organising them in 2004, the Social Development and Combat to Hunger Ministry. Prior to 2004, the institutional responsibility for social protection was fragmented across several ministries.
Impact of Cadastro Único governance project & Senarc
One particular project that managed to enhance the effectiveness of the BFP was the World Bank’s governance project (see table 5.1), aimed at improving basic programme management, oversight and control. This was done on three levels, namely nation-wide utilisation of the registry of beneficiaries (the Cadastro Único); management of benefits; and electronic monitoring of compliance with education and health conditionalities. Project finance was used to:
i) Train and provide technical assistance to state and municipalities to support the use of Cadastro Único as the main mechanism for selecting BFP’s target population
ii) Create municipal- and state-level delivery units to support BFP design and monitoring and to interact with social service providers, including transfer of dedicated resources to serve the BF population
iii) Configure Cadastro Único to allow multiple public agencies to select beneficiaries from its database of low-income families

The seriousness with which social protection has been approached by the Brazilian government since the return to sustained economic growth (following the end of military rule) is aptly demonstrated by the array of institutions that were created to implement cash transfers and other specific social services, as illustrated by table 5.2 and the comprehensive range of functions undertaken by the National Secretariat for Citizen Income (known by the acronym of Senarc), (see table 5.3.)

Some concerns over future fiscal affordability
At the end of 2021, the BFP rather dramatically ceased to formally exist, with Brazil’s head of state, Pres. Jair Bolsonaro sanctioning a new cash transfer program called Auxílio Brasil. It is well-known that the success of the BFP was a mainstay of a previous head of state, Lula da Silva (leader of the Workers’ Party), who is now in opposition and, according to recent polls, more than likely to be re-elected in 2022. Bolsa Família has won international acclaim for reducing extreme poverty in Brazil and enjoys overwhelming popular support in the country.

The new programme has already started paying out an average amount of R$223 per month, 18% more than the average under the BFP. The number of beneficiaries has also been increased to an estimated 14.6m families, up from the 13.9m under the BFP, which ran for 18 years before being terminated (de jure) at the end of 2021.

Judging by the weakness of Brazil’s currency during the second half of 2022 and the rise in the country’s long-term bond yields (see figure 5.1), investors are fearful of an erosion of fiscal rectitude. Oxfam Brazil is on record for sharing the concern over insufficient fiscal guarantees for the new programme, whilst also pointing out its lack of fully defined values. In the past, Pres. Bolsonaro had regularly voiced criticism over the BFP, referring to the programme as being socialist. His about-turn in implementing a cash grant system that is more expensive to the fiscus seems to be heavily influenced by political ambition aimed at possible re-election (Harris et al, 2021). Government’s stated aim is to raise the monthly grant to R$400 per month, which will amount to more than double the previous level.
In order to make sufficient funds available for Auxílio Brasil’s hefty increase, government has changed the reference period for calculating inflation, in order to lift the constitutional cap on spending that limits budget increases in line with inflation, as well as delaying the payment of certain court-ordered state debts. Although these amendments do not represent a technical breach of the fiscal ceiling, the deferment of state obligations may be viewed as a path to a possible default, which will render the new programme unsustainable.
The rule on fiscal spending limits was passed by Congress in 2016 with the aim of getting public finances back into shape and is viewed as a cornerstone of Brazil’s economic credibility. Draft legislation before Congress proposes changing the reference period for calculating inflation in order to lift the “ceiling”, as well as delaying the payment of certain court-ordered state debts. The total public debt of Brazil is currently at a level of 83 per cent of GDP and insufficient control of the public finances is bound to lead to macroeconomic instability.
Global fund managers are compelled by law to adhere to strict governance rules and prescribed mandates regarding sound investment practice. Once a country’s public debt breaches a certain limit, the taps for inward portfolio investment start turning off, thereby exacerbating an already untenable fiscal scenario, with grave implications for the economy. Although government’s intention to bypass the constitutional cap on spending does not represent a technical breach of the fiscal ceiling, the deferment of state obligations may be viewed as a path to a possible default, which will render the new programme unsustainable.
Reasons for the success of Bolsa Família
Contrary to much stereotyping, T’Hart & Compton (2019) have provided substantial evidence that democratic governments are often quite good at what they do. Their research has developed the following definition of public policy success: The creation of outcomes that are valued and sustained by a broad majority of society through a coordinated policymaking process.
Brazil’s Bolsa Família programme clearly fits the mould of international policy successes and the country is widely regarded as having pioneered the implementation of CCTs in the developing world. The first experiences with CCTs took place in the mid-1990s in Brazil, at municipal level. Variants of the Brazilian social protection policy instruments were later adopted at the national level in Mexico, as well as in most other Latin American countries and in the rest of the developing world. It was estimated in 2017 by the World Bank that social protection mechanisms designed on the Bolsa Família principles had been adopted in more than seventy different countries. Key reasons for the success of the BFP are as follows:
1. Partnership between civil society and the state
An important issue underpinning the success of the BFP is the Constitutional obligation to promote decentralisation and social participation at all levels of policy making, imprinting a unique feature to social policy in Brazil. According to Coutinho (2014), this has served to facilitate complementarity between representative and participative democracy. As a result, several national social policy councils have been created that comprise both representatives of civil society and public institutions, thereby aligning to a significant extent the wishes of the electorate with the regulatory and policy powers of government (at all levels). These councils are not merely involved with the implementation of welfare grants, but also cover other social policy areas, including education, health, labour, food security, and development in its broadest sense. They follow clearly defined responsibilities, and in some cases, they have ruling power to define policies’ directives and resources (Jaccoud et al 2010). During the Bolsa Família policy design process, local stakeholders included high-level federal bureaucrats, poverty campaigners, academics, and the World Bank. After a period of initial conflict among the ministries managing the existing CCTs, the BFP ultimately was supported by all stakeholders, recognising the need to unify efforts in the context of combating poverty
2. Lowering of poverty
The Bolsa Família programme represents the most progressive social welfare system implemented and maintained by the federal government of Brazil and has proven to be a programmatic success in reducing poverty and inequality. According to Paiva et al (2019), extreme poverty in the country would be one-third higher in the absence of BFP transfers and it accounted for just above 15 per cent of the fall in the Gini coefficient during the first decade of the twenty-first century.
3. Positive human capital development
A large and growing volume of impact evaluation have clearly demonstrated positive effects on school attendance (Brazil) and school progression (Brazil). Several health outcomes improved as a result of the programme, including under-5 mortality rates.
4. Employment creation
Concerns about adverse effects on labour supply and fertility have also shown to be misplaced (Gerard et al, 2019) and these positive results were widely publicised. Even in cases where a disincentive effect on labour supply was present amongst beneficiaries, the increased level of consumption expenditure stimulated output and employment in relevant sectors of the economy.
5. Sound administrative processes
The administrative capacity of the BFP was developed over a period of two decades, which meant that the programme was a process success. The programme was kept free of undue political interference. Permanent civil servants that occupied key administrative positions were appointed on the merits of their qualifications and experienced and not nepotism or loyalty to a particular political party, which meant that programme implementation was impersonal and transparent.
6. Decentralised system
The programme also employed appropriate mechanisms of coordination between different government areas and levels. The decentralised architecture of the BFP was considered innovative, whilst promoting incentives for quality implementation (Lindert et al.).
7. Sound governance standards
With the assistance of international experts and the World Bank, the structure of governance became progressively more capable of responding to technical implementation challenges, which eventually refined measurable policy outcomes.
8. Political appeal
Progress towards a more effective programme was accompanied by growing political support. Unequivocal affirmation hereof was provided at the beginning of 2022, when Pres. Jair Bolsonaro, who had previously been a vehement critic of the BFP, embraced the programme as part of his attempts to be re-elected in October 2022. Despite changing the name of the BFP to Auxílio Brasil and tinkering with some of the details – including raising the benefit levels, the principles, coverage and monitoring of the BFP remains intact. The popularity of the BFP eventually became a focal point in Brazil’s elections, both at municipal and national level, as demonstrated in the last two presidential elections, when all candidates that were regarded as relevant, declared support for the programme. The programme was therefore a political success.
9. Electoral impact
There is also evidence that the programme had positive impacts on political support for incumbent candidates across four presidential elections (Zucco Jr.). Opinion polls conducted on the general elections showed that three out of four voters were favourably disposed towards Bolsa Família, with approval above 50 per cent across all age, sex, race, religion, school and regional groups. In the last two presidential elections, all relevant candidates declared support for the programme (Paiva et al. 2019). According to comprehensive research by Zucco Jr on the so-called “Bolsa Família-effect” during four elections between 2002 and 2014, the effect was not regarded as large enough to swing a presidential election, at least until 2014, when estimates pointed to a huge increase in the number of votes that were swayed, from 3.6 million in 2010 to 8.1 million in 2014.
10. International recognition
After some growing pains during the initial years of implementation, the administration of the BFP improved and this was reflected in positive assessments from a host of evaluation studies. Lindert and Vincensini (2010) have documented the interplay between policy effectiveness and political support - sound technical management and positive policy outcomes fed back into political support. These positive policy outcomes led scholarly researchers and multilateral organisations to support the programme as an efficient tool in the fight against poverty in Brazil, which became globally relevant, with the key elements of the BFP having been replicated all over the developing world.
11. Endurance
The programme has also demonstrated resilience in the face of tumultuous political events – first with the impeachment of Pres. Dilma Rousseff in 2016 and then, a year later, with the conviction on corruption charges of Brazil’s most popular democratic president and pioneer of the BFP, Lula da Silva. The BFP also managed to survive the fiscal crisis of 2014 to 2017, caused by multi-dimensional factors stemming from the fact that it took many years for Brazil’s economy to recover from the global financial crisis. Other contributing factors were the rigidity of the public financial system, persistently low levels of business confidence, unduly strict monetary policy and the ineffectiveness of countercyclical policies (Holland 2019). The downgrading of the country’s government bonds from investment grade shortly after achieving this status for the first time also had a negative impact on inward portfolio investment. Nevertheless, at the transition of the BFP to the Auxío Brasil at the end of 2021, there were 43.7 million people registered with the CadÚnico and in 2018 the benefits were adjusted at above-inflation rates. The success of the policy has clearly endured.
Postscript
One of the main virtues of the Bolsa Família programme is that it reaches a signification portion of Brazilian society that has never benefited from social programs. It is among the world’s best targeted programs, because it reaches those who really need it. An estimated 94% of the funds reach the poorest 40% of the population and various studies indicate that most of the money is used to buy food, school supplies, and clothes for children.
Success has sparked adaptations in more than 70 countries - including Chile, Mexico, and other countries around the world, such as Indonesia, South Africa, Turkey, and Morocco. Between 2007 and 2010, New York City implemented the Opportunity NYC conditional cash transfer program, modelled on Bolsa Família - an example of a post-industrial country adopting the experiences of a developing country.
The results of Bolsa Família show that it is possible to lower poverty in a sustained manner, integrating millions of people into the economic and social mainstream of the country, without compromising other economic development goals.
Chapter 6: Country case study no. 2: India
The employment guarantee approach
Between 2002 and 2019 (just before the Covid pandemic), India experienced exceptionally high economic growth. In US dollar terms, the country’s gross domestic product (GDP) at current prices increased from $524 billion to $2.8 trillion over this period – an average annual growth rate of 10.4%. In real terms, GDP per capita increased from just below $2,700 to just below $6,700 (at purchasing power parity in constant 2017 international dollars). This represents an average annual growth rate of 6% and is a clear indication of progress with the country’s growth and development policies.
Despite relatively high rates of economic growth since a return to democracy, rural poverty continues to be a policy concern in India. An estimated two-thirds of the country’s population live in rural areas, accounting for 75% of all impoverished citizens in India (Breitkreuz et al 2017). Poverty is especially concentrated among Scheduled Castes (SCs) and Scheduled Tribes (STs). Although these two groups represent 33% of the population, they account for an estimated 80% of the rural poor.
Although the criteria for classification as SCs and STs are not spelt out in the Constitution, they have become well established, subsuming the definitions contained in the 1931 Census and various official Commissions. Scheduled Castes have always been an integral part of the Indian society and have been socially and economically disadvantaged over a long period. (Breitkreuz et al 2017). Tribal communities live in various ecological and geo-climatic conditions ranging from plains and forests to hills and many areas that are hardly accessible. Tribal groups are at different stages of social, economic and educational development. Some tribal communities have adopted a mainstream way of life, whilst others (75 in total) are known known as particularly vulnerable groups, who are characterised, to a varying degree, by the criteria listed in table 6.1.

Guaranteeing rural employment
As is the case in many other developing countries, India has also been grappling with a low labour force participation rate, estimated at 48.1% in 2019 by the World Bank (2022). In an attempt to address the problems posed by large-scale unemployment and pervasive poverty, the Government of India introduced several nationwide schemes to address poverty, including, in 2005, the Mahatma Gandhi National Rural Employment Guarantee Act (commonly referred to as NREGA). The scheme has two main objectives – to enhance the livelihood security of people in rural areas, and to boost the rural economy. It does so by guaranteeing wage employment to members of rural households who have volunteered to do unskilled manual work and through public works, including water-resource management and tree-planting.
It aims to enhance livelihood security in rural areas by providing at least 100 days of wage employment in a financial year to at least one member of every household whose adult members volunteer to do unskilled manual work. Women are guaranteed one third of the jobs made available under the NREGA. Table 6.2 provides a concise overview of the characteristics of this flagship programme aimed at poverty relief.
The major thrust of the National Rural Employment Guarantee Act (NREGA) in India is to provide part-time employment to unskilled rural dwellers. Its emphasis is on water harvesting initiatives, supplemented by other infrastructure-related projects closely linked to water management and agricultural production. In a country where more than 500 million people are estimated to be dependent on rain-fed agriculture (equating to almost 7% of the world’s total population), these are indeed worthwhile objectives.

The NREGA is closely associated with other important watershed initiatives, including the Integrated Watershed Management Programme (IWMP) in the state of Karnataka. These initiatives strive to provide livelihood options to disadvantaged persons in rural areas, whilst also improving the natural resource asset base.
A Poverty and Social Impact Analysis (PSIA) of the NREGA implementation in the state of Karnataka was commissioned by the World Bank Group in 2012. The study found that the NREGA budget in 2011/12 was more than one billion US dollars, with between 30% and 40% of disbursements directly linked to soil and water conservation (Satish, et al. 2013).
The key success of the initiative was in the area of employment. Between 70% and 80% of a total of more than 5 million job card holders had received employment under the scheme. Although few households had availed themselves of the full 100 days per annum of employment guaranteed under the scheme, the average number of days amounted to 50.
Income earned from participation in the scheme represented between 5% and 15% of total income and the study concluded that public works schemes such as these had the potential to provide long-term poverty reducing impacts.
A benefit-cost analysis of the schemes pointed to a payback period of about five to six years. The PSIA noted a number of misgivings surrounding the implementation of the NREGA, especially its minimal impact on closing the poverty gap in the areas surveyed and on outward migration to cities and other farming communities.

The PSIA also included an assessment of the potential benefits of convergence between the NREGA and the IWMP. This list is quite comprehensive and is summarised in table 6.3. The relevance of these potential benefits to South Africa are fairly obvious, as the Expanded Public Works Programmes (EPWP) represents a pragmatic vehicle for the implementation of future workfare programmes (as discussed in the following sub-section).
When utilising the IWMP in India as a proxy for other critical infrastructure-related projects, it becomes quite obvious that several of these potential advantageous outcomes could be achieved in South Africa, with the added benefit of an existing blueprint for combining workfare with a considered selection of public works programmes relevant to domestic circumstances.
Rural housing via workfare and subsidies
According to the United Nations, India, with its 1.4 billion people, will overtake China as the world’s most populous country in 2023. Estimates of widespread poverty vary, depending on the definition of the poverty line. An estimate by the United Nations (2019) points to 364 million living in poverty, but research by Roy & van der Weide (2022) concluded that the poverty headcount rate in India had declined by 12.3 percentage points between 2011 and 2019 (from 22.5% to 10.2%), with reductions in rural areas having been more pronounced than in urban areas. Although this represents considerable progress, it still translated to 168 million people living in poverty prior to the outbreak of the Covid pandemic.
It is unsurprising, therefore, that India has placed considerable emphasis on social welfare programmes involving some element of workfare. Due to a low per capita income, the country has limited fiscal resources and a public debt/GDP ratio that has increased from 66.6% in 2014 to 74% in 2020. One of the country’s key initiatives to combat rural poverty is the Indira Awaas Yojana (IAY) programme, based on the provision of grants for the construction of houses to members of SCs, STs, freed bonded labourers and to non-SC/ST category below the poverty line. The programme was launched in 1985 by Rajiv Gandhi, the then Prime Minister of India and was restructured as Pradhan Mantri Gramin Awas Yojana in 2015.
The objectives of the programme are:
To support the construction of houses with ample provisions, including workplaces within the house and designed on the basis of the dweller’s requirements
To promote the use of technology and material that is environment-friendly, sustainable, affordable, and conducive for generating employment
To empower and encourage local authorities (Panchayats) to take a lead role at the village level for the implementation of this housing scheme
The houses will be under the joint ownership of the husband and wife (where relevant)
The construction of the houses should be carried out by the beneficiary, and no contractors are to be involved
Addressing the Urban Conclave held in Uttar Pradesh's Lucknow on 5 October 2021, Prime Minister Narendra Modi stated that, since 2014, the construction of 11.3 million houses had been approved, most of which have been completed. Under the scheme, women will enjoy full or joint ownership of 80% of the houses.
Economic impact assessment of three flagship programmes
Realising that most of the research on the economic impact of social protection programmes was concentrated in the field of fiscal parameters, Sharma et al (2016) decided to evaluate the economic impact of three major social protection programmes, namely, the Mahatma Gandhi National Rural Employment Guarantee Act (NREGA), Indira Awaas Yojana (IAY), and the National Social Assistance Programme (NSAP) in 2011/12 utilising a social accounting matrix (SAM) multiplier analysis.
The authors drew on the premises identified by Mathers & Slater (2014), namely that social protection has a potential impact at the micro level (individuals and households), intermediate level (local-economy), and at the macro level (national-economy) through different channels. These include:
At the micro level - an impact on growth through preventing the loss of productive capital,; the accumulation of productive assets,; enhanced access to labour markets; increasing innovation and risk-takin; and increased investment in human capital.
At the intermediate level - an impact on growth through multiplier effects on the local economy; investment in public productive assets and infrastructure; and alterations to the functioning of the local labour markets.
At the macro level - an impact on growth directly by increasing household productivity and employment; increasing aggregate demand; deepening capital markets; broadening the taxation base; and changes to public debt
It is further recognised that social protection can influence these outcomes indirectly (to a varying degree) by facilitating economic reforms; building human capital; contributing to social cohesion; and influencing demographic trends. No over-arching framework of social protection exists in India. Although there are some constitutional provisions and international conventions, which are ratified by the Government of India. In the absence of such a coordinated framework, it is estimated that there are more than thousand social protection programmes (SPPs) of varying scope being implemented by the state governments, the central government, or jointly, usually with the involvement of local authorities. Due to the non-availability of sufficient and reliable time-series data on other programmes, the study by Sharma et al was confined to three major social protection programmes implemented by the central government The NREGA, IAY, and NSAP. The macroeconomic impacts have been measured in terms of output, income, employment, and revenue effects.
A 32 sector SAM of India for 2007/08 was been constructed with two factors of production (labour and capital) and five household categories, for both rural and urban areas. The household categories were categorised in quintile classes based on monthly per capita expenditure for both rural and urban areas.
The main data sources were the input/output (I/O) table for 2007/08; the 66th consumer expenditure survey by the National Sample Survey Office; the income/expenditure survey by the National Council of Applied Economic Research for 2004/05, and National Accounts Statistics by the Central Statistics Office. The impact was evaluated of the three selected SPPs on the expenditure incurred by the government on during 2011/12.
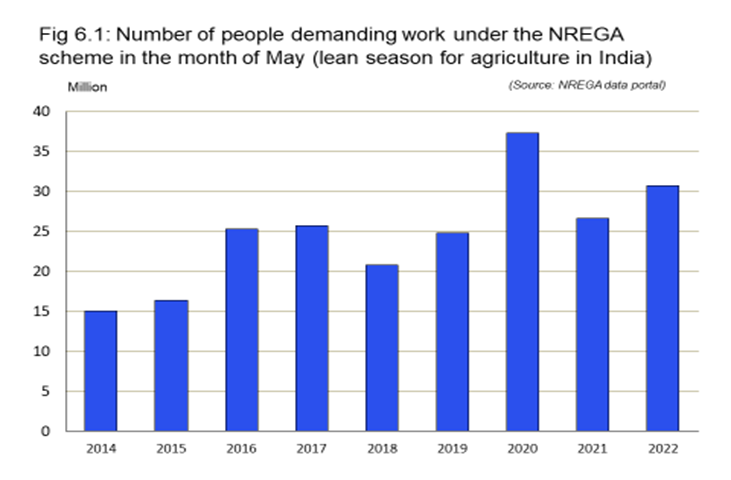
The study found that these programmes have significant output effects. The indirect output effects are higher than the direct output effects due to linkages with other sectors of the economy. Moreover, these programmes have generated employment for large numbers of people, both directly and indirectly. From an employment perspective, there is no doubt over the significant impact of NREGA, as illustrated by the large numbers of people demanding work under this scheme (see figure 6.1).
The income effect of these programmes is found to be almost twice the value of government expenditure on the selected SPPs. In general, a higher income effect was evident for the bottom classes of rural households, in line with the objective of poverty alleviation. The programmes also generated significant government revenue through taxation (directly and on the induced income and consumption). Tables 6.4, 6.5 & 6.6 provide details of the macroeconomic impact of these three SPPs.


Chapter 7: Macroeconomic impact of social welfare – international
Since the beginning of the new millennium, there has been unprecedented interest in the outcomes of social protection policies (SPPs) as a method to improve the aggregate welfare and level of human development in low-income and middle-income countries. Most of the academic & empirical studies in this field have concentrated on the effects of SPPs on lowering the prevalence of poverty and inequality and also on the effectiveness of social protection in targeting the poor, as discussed in detail in section 4.
Those that have utilised econometric analysis to gauge the effects of social welfare policies on economic output and growth (and, as an inference, on fiscal stability), have been sparse, especially due to the relatively short time span since the developing world has embraced the concept of social protection via non-contributory grants and other benefits aimed exclusively at improving the well-being of the poorest segments of society.
A comprehensive literature review has nevertheless resulted in a number of relevant impact analyses of the macroeconomic impact of SPPs that have been conducted in post-industrial countries and developing countries alike. This section highlights the key conclusions drawn from selected and relevant scholarly research, based on quantifiable evidence.
i) Haile & Niño-Zarazúa, (2018) – 55 countries
This study provided some insight into the effect of government spending on health, education and social welfare on three measures of aggregate welfare, including the Human Development Index (HDI), which incorporates a substantial weighting related to GDP per capita. The study utilised longitudinal data from 55 developing countries from 1990 to 2009 and found strong evidence to support the proposition that government social spending had played a significant role in improving aggregate welfare in the developing world.
ii) United Nations (2018) – global
According to its 2018 Report on the World Social Situation, the United Nations stated that social protection is fundamental for achieving the Sustainable Development Goals (SDGs). The UN’s research showed that, despite gaps in coverage, social protection systems are crucial to keeping people out of poverty, whilst contributing to gains in health and education among beneficiaries and reducing income inequality. In terms of the macroeconomic impact of social protection, it can also stimulate demand and boost consumption, and hence contribute to economic growth. During recessions, social protection spending can help revive economies and stimulate employment.
iii) International Labour Organisation - ILO (2011) – global
Research by the ILO confirmed that measures such as cash benefits, old-age pensions, in-kind transfers and disability benefits were instrumental in cushioning the impact of the 2008/09 global financial crisis among the most vulnerable groups in society, while also serving as a macroeconomic stabiliser and enabling people to overcome social exclusion and poverty in both developed and developing countries.
iv) Organisation for Economic Co-operation and Development – OECD (2019) – global
At the individual and household level, this study by the OECD on the economic effects of social protection policies identified a number of channels that have a positive impact, including via the accumulation & preservation of productive assets and the stimulation of innovation and entrepreneurship. The OECD also found that social protection can exert a positive effect on growth outcomes at community and national levels by generating multiplier effects from increased local consumption and production. The study pointed out a number of indirect effects that could further spur growth, including the facilitation of economic reforms, building human capital and enhancing social cohesion.
v) Gechert, et al (2021) – Germany
This study involved a narrative dataset of legislative social security shocks, constructed for Germany. The dataset covered major legal changes in benefits and contributions from 1970 to 2018. The macroeconomic effects were estimated in a proxy structural VAR. In response to a cut in contributions, a fiscal multiplier of about 0.4 on impact occurred, that faded relatively quickly. For benefit increases, however, the impact multiplier was 1.1 and more persistent. The response of other macro variables suggested that benefits worked through a strong demand-side channel, while contributions exhibited supply-side effects. Combining the shocks with household data confirmed a strong consumption response of beneficiaries.
vi) Romer & Romer (2016) – United States
In 2016, Romer & Romer published a study aimed at determining the effects on the macro-economy of increases in social benefits in the US. The methodology and results of the study are widely regarded as one of the academic benchmarks for embedding changes to social benefits in a vector auto-regression (VAR) framework. Although the data utilised for this study (1952 - 1991) pre-dates the universal implementation of UCTs and CCTs in the developing world, the results remain relevant to any assessment of the macroeconomic impact of social welfare expenditure by the state.
The study determined that social security benefit increases over the reference period were highly irregular in timing and size, and presents evidence that most of the increases were not taken in response to current or prospective macroeconomic developments or as part of larger policy programmes. As a result, these benefit increases can be used to estimate the short-run macroeconomic effects of changes in transfers.
The key finding of the study is that transfers matter. The estimates suggest that a permanent increase in Social Security benefits raises aggregate consumer spending in the first month the larger benefits arrive roughly one-for-one. The initial impact is highly statistically significant and remains high for about half a year, after which it declines. An interesting conclusion was related to the estimated response of consumption to temporary benefit increases, which were found to be small and not statistically significant.
The study also compared the impact of permanent social security benefit increases with relatively exogenous tax changes, which showed a marked contrast. While the tax changes are slower to impact on consumption, their effects were much more persistent, more statistically significant, and far larger over an extended period than those for benefit increases. As a result, tax changes affect broader economic indicators, while benefit increases do not. Both types of changes had their primary impact on total consumption by raising expenditures, especially on durable goods.
vii) Nikiforos et al (2017) – United States
The underlying premise for the Levy Institute’s research on an unconditional cash grant in the US was that it would substantially alleviate extreme poverty, which has been on the rise during an era in which existing unconditional transfer policies had been scaled back and repurposed. Although ample evidence of the global poverty-alleviation effects of welfare grants had been provided by a large volume of quantitative research, most notably the World Bank’s ASPIRE data-base, questions still remained over the likely impact of such a policy on the macro-economy.
In attempting to provide an answer to this question, Nikiforos et al (2017) utilised the Levy Institute macro-econometric model to estimate the impact of three versions of such an unconditional cash assistance program over an eight-year time horizon. The Levy Macro-Economic model is used to examine the medium-run prospects of the US economy and to simulate the effects of alternative policy options. It is Keynesian because the macroeconomic performance of the economy is driven by aggregate demand both in the short- and medium-run. Moreover, it follows the so-called Stock-Flow Consistent macroeconomic methodology, which allows for an integrated treatment of the real and financial sides of the economy;
After the global financial crisis of 2007-2009, analyses based on the Levy model have argued that conventional projections for the U.S. economy (for example, those produced by the International Monetary Fund) have consistently been overoptimistic. The same reports have also demonstrated that the extreme inequality in income distribution was one of the main causes of the economic crisis, and they have argued in favour of a large public infrastructure program (such as is currently being implemented by the Biden administration).
Three versions of unconditional cash transfers (UCTs) were examined by Nikiforos et al (2017), namely $1,000 per month for all adults, $500 a month for all adults, and a child allowance of $250 per month. For each of the three versions, the macroeconomic effects of these transfers were modelled, using two different financing plans - increasing the federal debt, or fully funding the increased spending with increased taxes on households. The results were then compared to the effects to the Levy model’s baseline growth rate forecast, as depicted by table 7.1 for two different funding models under two different levels of UCTs. The findings included the following:
For all three designs, enacting the grants and funding them by increasing the federal debt would grow the economy.
Under the smallest spending scenario, $250 per month for each child, GDP is 0.79% larger than under the baseline forecast after eight years. According to the Levy Model, the largest cash program - $1,000 for all adults annually - expands the economy by 12.56% over the baseline after eight years (excluding distributional effects). After eight years of enactment, the stimulatory effects of the program dissipate and GDP growth returns to the baseline forecast. Importantly, though, the level of output remains permanently higher.

When funding the policy by increasing taxes on households and incorporating distributional effects into the model, the economy also grows, but at a slower rate.
In a fiscally neutral aggregate model, a universal basic income grant (BIG) has negligible effects because the increase in the income of the households is fully compensated by the increase in taxation. However, a program related to comprehensive cash transfers like this implies a more egalitarian distribution of income - to the extent that it is financed by the increase in the taxes of households in high-income brackets. From a macroeconomic point of view, this translates into income gains for households with a higher marginal consumption propensity (MCP) and income losses for households with a lower propensity to consume.
Although not specifically modelled by the 2017 Levy Institute model, it stands to reason that UCTs targeted at poorer households will exacerbate the distributional effects inherent in the model (as has been confirmed by other econometric studies discussed in this section).
viii) Furceri, & Zdzienicka (2012) – OECD
The aim of this study was to assess the short-term effects of social spending on economic activity, using data from a panel of OECD countries from 1980 to 2005 and employing ordinary least squared (OLS) methodology. This involved the standard approach developed by Romer & Romer (1989), based on an estimation of a dynamic growth equation and the derivation of impulse response functions from the estimated coefficients.
From a theoretical point of view, the authors identified at least four channels through which social spending is likely to affect output positively in the short term:
First, an increase in social spending will increase demand by rising public consumption
Second, since a number of social policies target low-income individuals and credit constrained agents, an increase in social spending is likely to have a positive impact on private consumption expenditure
Third, some measures of social spending, such as active labour market polices, may affect output by increasing employment (especially in the area of public works)
Fourth, social spending in health may affect investment by enhanced human capital and, to the extent that private and public investments in the health sector are complementary, also by rising capital expenditure in the health sector
The authors included a test to determine the existence of crowding-out versus crowding-in effects on consumption and investment. The results suggested that while social spending had a positive and significant impact on consumption (mostly determined by health and unemployment benefits), it had a negligible and insignificant impact on private investment
The key conclusion derived at is that social spending has a significant short term effect on output - a 1% increase in social spending increases output by 0.12 percent in the short term and by about 0.25 after three years. In terms of multiplier effects, the estimates imply that an increase of social spending of 1 percent of GDP increases output by 0.57 percentage point. Furthermore, the increase in social spending has to be interpreted as social spending shock which leaves the debt-to-GDP ratio unchanged.
A third finding was that social spending was counter-cyclical in most of the countries. Countries with higher public debt and with a higher initial level of the ratio of total social spending to GDP were characterised by a lower level social spending growth.
ix) Gerard et al (2021) – Brazil
This study contributed to the literature on social welfare impacts by studying the effects of a large-scale means-tested cash transfer programme (the Bolsa Familía - BFP in Brazil) on aggregate formal employment in local labour markets. It is well established that cash transfer programs have expanded widely in developing countries and have been credited for sizable reductions in poverty. However, their potential disincentive effects on the labour supply by beneficiaries have remained open to debate. The one argument is based on concerns that the targeting of some of these programmes, such as the use of means testing, could distort beneficiaries’ incentives to work, especially in the formal economy where earnings are more easily verifiable.
By contrast, some studies argue that cash transfers can help beneficiaries find better jobs by unlocking liquidity constraints or that they can stimulate labour markets through increases in labour demand due to multiplier effects in the local economy. In practice, these effects can coexist, but evidence exists on their relative importance to inform the policy debate, despite formal job creation representing a primary focus of economic policies in developing countries. The reasons are obvious, as formal jobs are more likely to provide workers with enhanced social security coverage and better working conditions and are also associated with higher output and total factor productivity.
The authors used longitudinal administrative data covering the universe of formal workers and BFP beneficiaries, along with the benefits disbursed through the program to estimate the impacts of a policy that increased the total number of BFP beneficiaries by more than 17 percent (or almost two million additional families) in 2009. One of the key findings was that higher grant payments increased local formal employment, by exploiting variation in the size of the expansion across Brazilian municipalities. The evidence is consistent with multiplier effects of cash transfers in the local economy, which dominate potential negative effects on formal labour supply among BFP beneficiaries.
The differential increase in total BFP payments led to an increase in the number of private-sector formal jobs that reached 2% by 2011, two years after the expansion of the system. The effect on total payroll was slightly smaller (1.7%) because the increase in formal employment was concentrated in lower-skill occupations. The results were robust across various specifications and definitions of treatment intensity. The study also explored whether the overall increase in formal employment occurs despite negative effects of PBF on beneficiaries’ formal labour supply or are partly driven by positive responses among beneficiaries. This was done by comparing formal employment outcomes for families that were eligible for different benefit amounts within a local labour market through a Regression Discontinuity (RD) design.
Taken together, the results of the study indicated that cash transfer programs are highly likely to exert positive effects on formal labour markets and the local economy at large, even if they create potential disincentive effects on beneficiaries’ labour supply. The study also included an estimation of the effects on municipal GDP and taxes paid in the municipality. The results were in line with formal employment results, with increases in local GDP and local taxes reaching 1.7% and 2.7% by 2011, respectively.
x) Brazil (various authors)
In Brazil, most of the studies of economic multiplier effects have been concentrated on public sector investment programmes in social and economic infrastructure. A number of macroeconomic impact studies of SPPs have nevertheless been conducted in Brazil, most recently by Sanches & De Carvalho (2022). The study was based on a structural vector autoregressive (VAR) modelling exercise, to determine fiscal multipliers for social benefits in Brazil for 1997-2018. Social protection multiplier dynamics can be enhanced since people who receive these benefits tend to have a relatively high propensity to consume. As reported by the Institute of Applied Economic Research Ipea (Sanches & De Carvalho 2022), 80 percent of resources transferred by the Bolsa Familia Programme (BFP) are received by the bottom two income quintiles.
Consumer expenditure data analysis in Brazil has found a consumption propensity of larger than one for the bottom income quintile, in contrast to only 0.43 for the top income quintile. The latter trend for a significant gap in consumption propensities between the rich and the poor is evident in all developing countries. It represents the fundamental logic behind the positive economic multiplier effects that have been determined in various studies on the impact of social assistance programmes.
The authors provided a disaggregated analysis which estimated social protection multipliers flowing from household consumption, private investment and different types of social benefits expenditures (including cash transfers, unemployment insurance, and pensions). Two periods were used as samples, with one that included Brazil’s economic recession of 2014 to 2016. The study revealed that a social protection spending shock triggers a more significant output increase in the sample that includes the recession.

Overall, the findings aligned with the range of estimates of short-term multipliers for total government spending on social protection presented in previous empirical studies, as depicted by table 7.2. In particular, the macroeconomic effects of social protection were found to be similar to the evidence provided by Resende (2019), as well as the study by Orair, Siqueira and Gobetti (2016), which provided evidence of more significant economic multipliers during economic recessions.
The study by Sanches & Carvalho emphasises that social protection expenditure performed a significant income stabilising effect via aggregate demand during this period. They found that Brazil’s GDP would have been 2.53% lower if social benefits had not continued to grow in 2016 and 2017 (due to constitutional obligations).
The key conclusion drawn from the above studies is that social benefits have relatively large multiplier effects in Brazil, comparable in size to those estimated for public investment, whether the economy is in recession or in growth mode.


LAPAKBET777LOGIN
ALTERNATIFLAPAKBET
LAPAKBET777DAFTAR
LAPAKBET777OFFICIALL
LAPAKBET777RESMI
SITUS TERBAIK DAN TERPERCAYA
slot demo X1000
scatter hitam
slot toto
situs slot online
situs slot online
situs slot online
situs slot
situs slot
slot gacor
toto singapure
situs toto 4d
toto slot 4d
pg soft mahjong2
mahjong2
pocari4d
pocari4d
pocari4d
pocari4d
pocari4d
pocari4d
pocari4d
terminalbet
terminalbet
terminalbet
terminalbet
terminalbet
terminalbet
data pemilu
utb bandung
universitas lampung