
The South Africa Social Cohesion Index: Measuring the well-being of a society - 2025 UPDATE
- Mar 4
- 38 min read


This report has been enabled
through the generous support of
Telkom
Copyright © 2026
Inclusive Society Institute
PO Box 12609
Mill Street
Cape Town, 8010
South Africa
235-515 NPO
All rights reserved. No part of this publication may be reproduced or transmitted in any form or by any means without the permission in writing from the Inclusive Society Institute
DISCLAIMER
Views expressed in this report do not necessarily represent the views of the Inclusive Society Institute or its Board or Council members.
March 2026
Author: Mari Harris (Ipsos South Africa)
Statisticians: Corné Bodenstein (Ipsos South Africa), Lungelo Mkhize (Ipsos South Africa)
Editor: Daryl Swanepoel (Inclusive Society Institute)
TABLE OF CONTENTS
Executive Summary
1. Introduction
2. Measuring social cohesion
2.1. Data
2.2. Analytical approach
3. Current level and trend of social cohesion
3.1. Social cohesion in South Africa
3.2. Social cohesion in the nine provinces
4. Structural influences on social cohesion
4.1. Data and methodology
4.2. Results
5. Individual experiences of social cohesion
5.1. Data and methodology
5.2. Identifying four classes of experience of social cohesion
5.3. Socio-demographics of the four classes
6. Social cohesion and subjective well-being
6.1. Provinces – data and methodology
6.2. Individuals
7. Conclusion and the way forward
References
Cover photo: istock.com - Stock photo ID:1440750455
LIST OF TABLES
Table 2.1: Sample sizes of Khayabus
Table 2.2: Factor loading of items per dimension within Domain 1
Table 2.3: Factor loading of items per dimension within Domain 2
Table 2.4: Factor loading of items per dimension within Domain 3
Table 3.1: Overall index and dimensions
Table 3.2: Overall index in the provinces
Table 3.3: Dimension 1.1 – Social networks in the provinces
Table 3.4: Dimension 1.2 – Trust in people in the provinces
Table 3.5: Dimension 1.3 – "Acceptance of diversity"
Table 3.6: Dimension 2.1 – Identification in the provinces
Table 3.7: Dimension 2.2 – Trust in institutions in the provinces
Table 3.8: Dimension 2.3 – "Perception of fairness"
Table 3.9: Dimension 3.1 – Solidarity and helpfulness in the provinces
Table 3.10: Dimension 3.2 – Respect for social rules
Table 3.11: Dimension 3.3 – Civic participation in the provinces
Table 4.1: Structural characteristics and social cohesion in South African provinces
Table 5.1: 2025 Results: Social Cohesion Dimensions and LCA
Table 5.2: Socio-demographic and -economic characteristics of the four classes of respondents
Table 6.1: Social cohesion and subjective well-being in the provinces
Table 6.2: Subjective well-being in the four classes of respondents
LIST OF FIGURES
Figure 1.1: Constitutive elements of social cohesion
Figure 1.2: Measurement concept of the Bertelsmann Social Cohesion Radar
LIST OF APPENDICES
Appendix A: Indicators of cohesion across time
Table A.1: Dimension 1.1 – Social networks results over time
Table A.2: Dimension 1.2 – Trust in people results over time
Table A.3: Dimension 1.3 – Acceptance of diversity results over time
Table A.4: Dimension 2.1 – Identification results over time
Table A.5: Dimension 2.2 – Trust in institutions results over time
Table A.6: Dimension 2.3 – Perception of fairness results over time
Table A.7: Dimension 3.1 – Solidarity and helpfulness results over time
Table A.8: Dimension 3.2 – Respect for social rules results over time
Table A.9: Dimension 3.3 – Civic participation results over time
Appendix B: Correlations of social cohesion on the province level
Table B.1: Structural characteristics and social cohesion in South African provinces
Table B.2: Social cohesion and subjective well-being in the provinces
Appendix C: Latent class analyses
Table C.1: Goodness-of-fit indices of LCA solutions
Table C.2: Relative class sizes for LCA solutions
EXECUTIVE SUMMARY
This report represents the fifth complete application of the South Africa Social Cohesion Index (SASCI). It updates the study published in February 2025 and focuses on the development and trends of social cohesion from 2021 to 2025. To recap, the study follows the measurement concept of the Social Cohesion Radar (SCR), developed by the Bertelsmann Stiftung. As illustrated in a graph in the report, the study assessed social cohesion in three domains:
Social Relations, including the intactness of social networks, general trust in people and acceptance of diversity
Connectedness, including identification with one’s place of residence, trust in institutions and perceptions of fairness
Focus on the Common Good, including solidarity and helpfulness, respect for social rules and civic participation.
The study uses data collected in the first wave of the Ipsos Khayabus study every year (two or three waves are conducted annually). This is a large-scale representative study of South African adults, conducted face-to-face in the homes and home languages of a randomly selected sample, covering all nine provinces and different types of settlements all over South Africa.
The Bertelsmann concept of defining a country’s level of social cohesion allows scores between 0 (no cohesion) and 100 (maximum cohesion). The decision of which score to regard as sufficiently high is both a normative and a political one.
Currently (2025), the overall level of social cohesion in South Africa as a whole is “moderate” at 56 points. Looking at its development since 2021, the country has achieved a slight increase of 2.5 points.
Since the commencement of the study, the dimension of identification (in the domain of Connectedness) has proved to be the strongest in South Africa, and it is still the case. The score for identification, currently at 76.7, has grown by 3.5 points since 2021. However, the biggest increases over this period were achieved by the measurement of civic participation, which grew 6.2 points since 2021, to now stand at 60.6, and solidarity and helpfulness, which grew 4.1 points, to now stand at 63.1 points.
At the other end of the scale, the lowest scores are still registered for respect for social rules (in the domain of Focus on the Common Good). This score currently measures 42, but it also grew by 1.7 points since 2021 and is now regarded as moderate and no longer low.
Still looking at the overall picture, eight of the nine dimensions registered growth from 2021 to 2025.
All nine provinces also registered moderate scores, clustering in a relatively narrow band, ranging from the Northern Cape at the bottom of the list with 51.7 and the Eastern Cape at the top of the list with 58.9.
This report also presents results from Latent Class Analysis (LCA), a procedure identifying distinct groups in society. Four groups were identified that experience different strengths and deficits in social cohesion in their immediate life contexts.
In the end, the report examines the relationship between social cohesion and subjective well-being. The evidence suggests that the quality of society (social cohesion) translates directly into citizens’ quality of life (subjective well-being).
It is exactly the strong positive relationship between social cohesion and subjective well-being that underscores the necessity of political action, planning and cooperation between government, business and civil society to improve South Africa’s level of social cohesion. Social cohesion translates the social and economic structures (like performance and output of the economy and living conditions) into the quality of life (issues like happiness, life satisfaction, etc.) directly experienced by individual members of society. In the case that cohesion is neglected, one can expect societal polarisation and instability.
1. INTRODUCTION
Since the earliest times leaders – religious, military and political – tried to keep their followers, soldiers or citizens/populations together, by inspiring behaviour and attitudes that foster unity of minds and actions. This spirit of social cohesion is thus not at all a new concept. There has recently been more interest in the subject, as proved by various studies and reports – see specifically the United Nations Economic Commission for Europe (UNECE) report titled, “Social Cohesion: Concept and Measurement”, published in 2023. This report states that a plurality of definitions and applications of the concept of social cohesion have been advanced by international governments and academic researchers – and they published a selection of definitions as put together by Statistics Canada in Tabular format (UNECE, 2023:4), which is copied here:

As in previous studies, the research commissioned by the Inclusive Society Institute (ISI) built on work by Langer et al. (2017) and Leininger et al. (2021). The Langer study used Afrobaromer data from nineteen countries and defined social cohesion in an African context as the interplay of three salient aspects: perceived inequalities, trust (interpersonal and institutional) and identity (national vs ethnic). The Leininger study also compared African counties. According to its authors, “cohesion is characterised by a set of attitudes and behavioural manifestations that includes trust, an inclusive identity and cooperation for the common good” (Leininger et al., 2021:3). These three attributes unfold into two elements, encompassing horizontal or vertical relations among citizens and the state (see Figure 1.1): social trust and institutional trust, group identity and national identity, intergroup cooperation, and state-society cooperation. (More information about these two studies is published in the 2024 update of this report.)

Figure 1.1: Constitutive elements of social cohesion
(Source: Leininger et al., 2021)
This 2025 report uses new data, collected during the first quarter of 2025, but it still aims to provide a theoretically-based and methodologically-sound empirical assessment of social cohesion in the South African society, with the view to deliver credibly on five goals:
To measure the current degree of social cohesion in South Africa as a whole and in each of the nine provinces separately.
To track how social cohesion has progressed (or not) from 2021 to 2025.
To identify structural characteristics from the thematic fields of the economic situation in the country, inequality and poverty, demographic developments, diversity and modernisation that can promote or hinder social cohesion.
To explore which social groups demonstrate high or low levels of social cohesion.
To investigate how social cohesion – very broadly seen as the quality of society – relates to citizens’ overall well-being, defined as their quality of life.
As in previous reports, we aimed to achieve these goals with the application and use of the measurement concept as defined by the Bertelsmann Social Cohesion Radar (SCR). This was informed by an initial comprehensive literature review (Schiefer & van der Noll, 2017) and the input of various experts on the topic. It defines social cohesion as the “quality of social cooperation and togetherness of a collective, defined in geopolitical terms, that is expressed in the attitudes and behaviours of its members. A cohesive society is characterised by resilient social relations, a positive emotional connectedness between its members and the community, and a pronounced focus on the common good” (Dragolov et al., 2016:6). These three domains unfold into three dimensions, as illustrated overleaf in Figure 1.2.
Each one of the dimensions comprises three measurements:
The “social networks” domain includes the measurements of
social networks,
trust in people, and
acceptance of diversity.
The “connectedness” domain includes the measurements of
identification,
trust in institutions, and
perception of fairness.
The “focus on the common good” domain includes the measurements of
solidarity and helpfulness,
respect for social rules, and
civic participation.

Figure 1.2: Measurement concept of the Bertelsmann Social Cohesion Radar
(Source : Dragolov et al. (2016))
As in previous reports, this report uses the comprehensive approach of the Bertelsmann Social Cohesion Radar in our analysis as the output is logical and insightful.
2. MEASURING SOCIAL COHESION
This section details the data and methodological approaches employed for measuring social cohesion in South Africa.
2.1. DATA
The data collected in this report have been put together over a period of six years (2020 to 2025) using the Ipsos Khayabus study as a vehicle. The Khayabus is an Omnibus study, conducted twice a year via face-to-face interviews in the homes and home languages of a representative sample of South Africans, 15 years and older. As not all the questions are asked to 15-17-year-olds, data have been filtered on the results for those 18 years old and older. In an Omnibus-type study, different clients take the opportunity to include questions on the master questionnaire. In this way the Inclusive Society Institute added questions to the first wave of the study in the form of a section called Gov-Dem-Poll. Data from the 2020 study have been used for preliminary testing, and deep analysis and modelling followed from 2021 onwards.
Data are collected in all nine provinces of South Africa, but sample sizes per province differ – depending on the overall population size in each province in comparison to the South African population. We do make use of some disproportionate sampling in the case of provinces with very low population figures, like the mainly arid and rural Northern Cape. In the end the data are weighted by different demographic criteria to reflect the true population spread in the country, according to published sex, age and working status proportions in each province. Data are also projected to overall adult population figures and are as such representative of the South African population, within a margin of error (depending on sample size, response rate and sampling methodology used).
This procedure is followed to provide a mirror image of the views of the overall adult South African population.
Thus, the smaller sample size used in some provinces (especially those with smaller populations than Gauteng and KwaZulu-Natal) do invoke a larger standard sample error for sample statistics. This means in practical terms that the precision of the measurements for Gauteng is about four times higher than that for the Northen Cape at the same variability in the data. Therefore, we advise caution when interpreting data for provinces in isolation.
The table overleaf provides the achieved sample sizes (N) and population-weighted relative frequencies (%) of respondents over time (from 2020 to 2025) for South Africa as a whole and the nine provinces.
Table 2.1: Sample sizes of Khayabus

Note: The table shows the absolute count (N) and population-weighted relative frequencies (%) of respondents from South Africa and its nine provinces in Wave 1 of the Khayabus surveys from 2020 to 2025.
2.2. ANALYTICAL APPROACH
A phased methodological approach was employed to select the appropriate survey questions (items/indicators) to measure the nine dimensions of social cohesion in line with the Bertelsmann concept. We then computed scores for each of the nine dimensions and the overall social cohesion index based on the scores.
Item selection was performed by using a multi-step procedure:
Each member of the research team independently identified potential items for measuring the nine social cohesion dimensions.
Members of the research team then jointly prepared a pool of items according to face validity.
Items from the pool were subjected to an exploratory factor analysis for each dimension.[3]
Finally, we assessed the internal consistency of the scales formed by the selected items to measure pertinent dimensions: Cronbach’s α coefficients should reach .90 for an excellent scale, .80 for a very good scale, .70 for a satisfactory scale, and minimally .30, or, in case of short scales, at least .10 times the number of items in the scale.
Several data preparation steps had to be taken before performing the factor analysis:
Where needed, the response options of the items were reverse coded so that a higher numerical value stands for a more vital expression of the pertinent aspect of cohesion.
The response option of all items was rescaled to range from 0 (weakest expression of cohesion) to 100 (strongest expression of cohesion).
If present, missing values on an item were substituted with the sample mean – fortunately the rate of missing values was very low.
Below and on the next two pages, Tables 2.2, 2.3 and 2.4 document the selected items’ factor loadings and the internal consistencies of the scale these items form for measuring the nine dimensions of social cohesion.
Table 2.2: Factor loading of items per dimension within Domain 1

Note: The table shows the factor loadings of the items from factor analysis for the pertinent dimensions. Values in parentheses refer to Cronbach's α coefficient of internal consistency of the scale, formed by the items selected to measure the pertinent dimension.
Table 2.3: Factor loading of items per dimension within Domain 2

Note: The table shows the factor loadings of the items from factor analysis for the pertinent dimension. Values in parentheses refer to Cronbach's α coefficient of internal consistency of the scale, formed by the items selected to measure the pertinent dimension.
a Loadings and Cronbach's α cannot be computed; substituted with mean from Khayabus 2020 - Wave 1
Table 2.4: Factor loading of items per dimension within Domain 3

Note: The table shows the factor loadings of the items from factor analysis for the pertinent dimension. Values in parentheses refer to Cronbach's α coefficient of internal consistency of the scale, formed by the items selected to measure the pertinent dimension.
a Loadings and Cronbach's α cannot be computed; substituted with mean from Khayabus 2020 - Wave 1
It is obvious from these three tables that not all dimensions of social cohesion were measured equally well over the five-year period of the study. There were several reasons for this:
The questionnaire offered a limited choice of indicators for some dimensions. This is why not all dimensions could be measured with at least three items. This is relevant to Dimension 2.1 (Identification) and Dimension 3.1 (Solidarity and Helpfulness).
Furthermore, for Dimension 2.1 (Identification) an item from the 2020 Khayabus had to be included, to assess citizens’ identification with South Africa in 2021.
Not all scales exhibit a high degree of homogeneity (the level of intercorrelation) of the included items. This is particularly true for Dimension 2.1 (Identification) and Dimension 3.3 (Civic Participation).
After sorting items via factor analysis, the nine-dimension scores were computed by calculating the arithmetic mean of the items determined to belong to a given factor. The overall cohesion index was calculated as the arithmetic mean of the nine-dimension score. Dimension and index scores for the provinces and the country as a whole were calculated by aggregating the individual-level data to the respective level via the population-weighted arithmetic mean.
Scores for the dimensions and the overall index range from 0 (very low cohesion) to 100 (very high cohesion), where:
Scores from 0 to 19.99 can be interpreted as pointing to a very low level of cohesion,
Scores from 20 to 39.99 as pointing to a low level of cohesion,
Scores from 40 to 59.99 as pointing to a medium level of cohesion,
Scores from 60 to 79.99 as pointing to a high level of cohesion, and
Scores from 80 to 100 as pointing to a very high level of cohesion.
3. CURRENT LEVEL AND TREND OF
SOCIAL COHESION
3.1. SOCIAL COHESION IN SOUTH AFRICA
Table 3.1 below illustrates the annual level and trend (development) of social cohesion in South Africa since 2021. Using the 2021 data as a base, it also shows the year-on-year development of dimensions of cohesion since 2021.
Table 3.1: Overall index and dimensions

Note: The table shows the scores of South Africa as a whole on the overall index of social cohesion and its dimensions in 2021, 2022, 2023, 2024 and 2025.
For this table and further tables, scores up to 19.99 (very low cohesion) are shaded in red, scores between 20 and 39.99 (low) are shaded in orange, scores between 40 and 59.99 are shaded in yellow, and scores above 60 (high cohesion) are shaded in green. The table also shows changes over time. Positive changes are given in green, and negative changes are indicated in red.
Looking specifically at the findings for 2025, the fact of four green scores is noticed immediately. In the past five years the dimension of “Identification” has consistently delivered green scores, but it was unfortunately the only one. The dimension of “Social Networks” started off well in 2021, but could only manage another green score in 2025, while the dimension of “Solidarity and Helpfulness” achieved green scores for the last two years. In 2025, “Civic Participation” also achieved a green score. It is clear that social cohesion is on a stronger footing than before, with the overall country index improving 2.5 points since 2021 to reflect an overall index of 56 for the year 2025. Currently, South Africa exhibits four green scores and five yellow scores. It is also an important finding that eight of the nine scores improved when comparing them to the situation in 2021. This is indeed a very positive result.
Another important finding is that the dimension of “Respect for Social Rules” showed an upward movement over the last year (from 2024 to 2025), with the score moving from orange to yellow.
The results show a nuanced profile of social cohesion in South Africa, covering quite a spectrum, from 42 to 76.7. It is notable that each one of the three domains includes at least one green score. When programmes are designed to promote social cohesion in the country, it would be advisable to use the essence of the green scores as main “selling points” to try to achieve movement on the other scores as well. As before, it is clear that the “glue” that holds the country together is still strongly reflected in citizens’ strong identification and affiliation with the country, at a score of 76.7 (3.5 points higher than in 2021).
On the other hand, three issues have the inherent potential to destabilise the South African society, namely:
Acceptance of Diversity (currently at 47.7 points),
Perception of Fairness (currently at 47.1 points), and
Respect for Social Rules (currently at 42 points).
3.2. SOCIAL COHESION IN THE NINE PROVINCES
The table overleaf shows the social cohesion scores for the nine South African provinces – all scores are in yellow, indicating medium-level index scores for the whole country.
In four provinces (the Eastern Cape, North West, Western Cape and Gauteng) the overall social cohesion score is higher than in the country as a whole. Especially the Eastern Cape and North West showed good progress over the last five years: the score in the Eastern Cape is 7 points higher than in 2021, while the score in North West is 7.6 points higher than in 2021.
The Northern Cape shows the highest points loss (7.5 points), from the 59.2 points measured in 2021 to the 51.7 measured in 2025. However, it has been mentioned before that findings in the Northern Cape will probably show greater variability and inconsistency than in other provinces, as the sample size is really low. (This vast province houses only 2% of the country’s population.)
Two other provinces also recorded a decline in Social Cohesion when the 2025 findings are compared to those from 2021, although these losses are much smaller than that in the Northern Cape: Limpopo lost 1.2 index points, and the Free State lost 0.9 index points. All other provinces are doing better regarding overall Social Cohesion index points than in 2021.
Table 3.2: Overall index in the provinces

Note: The table shows the scores of the nine South African provinces on the overall social cohesion index from 2021 to 2025.
The table also shows changes over time. Positive changes are highlighted in green, and negative changes are highlighted in red.
The next nine tables will show the nine provinces’ performance on the three domains and nine dimensions of Social Cohesion over the five reporting periods/years. It will become clear that none of the provinces exhibit a consistent profile – in other words, each province has its strong and weak points when it comes to Social Cohesion.
The only exception is the strength of the dimension of identification with the country, which is high across all provinces.
THE “SOCIAL RELATIONS” DOMAIN
Table 3.3: Dimension 1.1 – Social networks in the provinces

Regarding social networks in the provinces, there are two clear groups in the country currently: the green group (good scores) and the yellow group (moderate scores). Social networks work well in the Western Cape, North West, Gauteng and Northern Cape. The other five provinces fare less well on this dimension and four out of the five have lost ground since 2021.
Table 3.4: Dimension 1.2 – Trust in people in the provinces

Eight out of the nine provinces perform moderately on this dimension. The exception is the Eastern Cape – not only is this province the best overall performer this year, but it succeeded in steadily improving on the Trust in People dimension every year for the last five years and ended on an index score 16.4 points higher than where it started in 2021.
Table 3.5: Dimension 1.3 – "Acceptance of diversity"

All nine provinces registered moderate scores on this dimension. In a country with so many different population groups, a high Gini-coefficient, very different levels of development and educational qualifications, and diversity in terms of home languages and religions, it is perhaps not surprising. However, the process of nation-building should definitely get more attention nationally. The other aspect complicating the sentiment about acceptance of diversity is the issue of immigrants. More about this later.
THE “CONNECTEDNESS” DOMAIN
Table 3.6: Dimension 2.1 – Identification in the provinces

It is clear that Identification is by far the strongest dimension of Social Cohesion in the country, as has been mentioned previously. Seven provinces consistently registered “good” results on this dimension, and in 2025 two provinces, the Eastern and Western Cape, have registered “excellent” results. This is a very strong element of Social Cohesion in South Africa’s favour and can possibly be employed in a clever campaign to help promote some of the other desired opinions and dimensions of Social Cohesion.
Table 3.7: Dimension 2.2 – Trust in institutions in the provinces

Another all yellow – i.e. moderate – performance. A campaign addressing Trust in general, and both the dimensions of trust in other people and trust in institutions, making use of good stories or talking about good experiences might work in the long run.
Table 3.8: Dimension 2.3 – "Perception of fairness"

The scores for the Perception of Fairness are all moderate as well, but on the lower half of the moderate category. South Africans do have an issue with this on many different levels – just think about how many times there are news articles about unfairness, unfair treatment, discrimination and related issues. One positive observation, though, is that all the scores in the provinces (bar one) have increased since 2021.
THE “FOCUS ON THE COMMON GOOD” DOMAIN
Table 3.9: Dimension 3.1 – Solidarity and helpfulness in the provinces

This dimension of Solidarity and Helpfulness is another strong performance area for South Africa and all nine provinces. Eight of the nine provinces are in the “good”/green category and only one in the moderate category in terms of the indices. To be helpful, caring and friendly is a way of life for many in the country.
Table 3.10: Dimension 3.2 – Respect for social rules

The dimension of Respect for Social Rules is by far the worst performer in terms of the Social Cohesion indices in South Africa – although many of the scores in the past five years have been much worse than those achieved in 2025. The related aspects of lawlessness, the attitude that “everything goes”, and even the reckless driving behaviour of some motorists count as everyday proof that South Africans have a low regard for rules, regulations and laws. This should not be allowed to continue.
Table 3.11: Dimension 3.3 – Civic participation in the provinces

With this last dimension of Civic Participation, the pattern looks very similar to the very first dimension of Social Networks – four provinces recording “good”/green scores and five recording yellow/”moderate” scores. This time the Eastern Cape, Gauteng, KwaZulu-Natal and Limpopo are the best performers, perhaps showing the strong sense of community in the three more rural provinces and even in the mainly metropolitan Gauteng province, where shared issues of service delivery have engendered a stronger sense of community and participation in local issues over the last year or so. It is also interesting that the scores for this dimension have all increased since 2021, with the Northern Cape again being the odd one out.
Although there is certainly still a lot of work to be done in the country concerning support and promotion of Social Cohesion, the index figures in general show a much more positive picture than five years ago, when we were still in the last phase of the Covid-19 pandemic and health, political and economic uncertainties were rife. Although the current situation in the country is not plain sailing, there is more participation and dialogue and the economy is slowly showing some tender green shoots, although growth is still severely inhibited.
4. STRUCTURAL INFLUENCES ON SOCIAL
COHESION
This section focuses on the structural characteristics of the provinces that may have an influence on the promotion or hinderance of social cohesion within the provinces, with the aim of finding evidence on structural determinants of social cohesion. To bring this about, we explore the relationship between the overall level of social cohesion in the nine provinces and selected characteristics of the provinces from different themes, namely, the economic situation, inequality and poverty, demography, diversity and modernisation. The focus on these aspects is not arbitrary, as studies of different societies and the circumstances within them have illustrated empirically that aspects from these themes act as determinants rather than outcomes of social cohesion (Dragolov et al., 2016; Arant et al., 2017; Bertelsmann Stiftung, 2018; Boehnke et al., 2024).
4.1 DATA AND METHODOLOGY
To touch on the economic situation in the provinces, we followed the same procedures as in previous studies and used data on the gross domestic product per capita[4] in South African Rand (ZAR) (Stats SA, 2025), Human Development Index (Global Data Lab, 2024), and unemployment rates – using both the official and expanded definitions of unemployment.
We measured poverty using one subjective indicator – the share of households in a province who perceive themselves as poor (Stats SA, 2024c), and objective indicators concerning three definitions of the poverty line[5].
We employed the Gini index of income inequality and the P90/P10 ratio (own calculations based on CRA, 2023) to measure inequality[6].
We drew on data from the official Census 2022 in South Africa (Stats SA, 2023a) for the remaining thematic fields. In particular, regarding demographics, we considered population density, the share of urban and rural populations, the share of single and married citizens, and the population’s median age. To tap into diversity, we used the share of blacks, whites, coloureds and Indians/Asians, and other races, the share of immigrants, as well as ethnic, linguistic and religious fractionalisation[7] (own calculations based on Stats SA, 2023a).
To measure modernisation, we used the share of citizens with completed primary, secondary and tertiary education, the share of citizens owning a computer and a mobile phone, and the share of the population without access to the internet (annual Khayabus results).
For reasons of data availability, all structural indicators, except GDP per capita, where the 2025 figure is used, refer to the years 2021, 2022 and 2023 (the latest Census was undertaken in 2022). The Khayabus data are from the year when fieldwork was undertaken. Thereby, some figures precede the most recent measurement of social cohesion. Although the intentional time lag – earlier measurement of the provinces’ structural characteristics and later measurement of social cohesion – introduces a certain degree of temporal order in the analyses, it cannot prove the existence of a causal relationship, but it can increase the plausibility of attributing causality.
Each of the above-listed structural characteristics of the provinces was subjected to a correlation test with the level of social cohesion. Two variables are correlated when changes in one are closely followed by changes in the other. A correlation can be positive (the more variable A, the more variable B) or negative (the more variable A, the less variable B). The strength of the association is reflected in the coefficient correlation, which can range from 0 (no correlation) to ±1 (perfect correlation). Typically, a correlation below .10 is very weak, between .10 and .30 is weak, between .30 and .50 is moderate, and above .50 is strong.
As before, we experimented with both Pearson and Spearman correlations. However, using Pearson correlations the low number of provinces (only nine) means that only extremely high correlations can reach statistical significance. As a parametric test, the Pearson correlations involve assumptions that cannot be fulfilled with the data on the level of provinces. Therefore, we again used Spearman correlations as a non-parametric, assumption-free alternative. A Spearman correlation is, in essence, a Pearson correlation performed on ranked data. The distinction between the two approaches is that a Pearson correlation considers the exact distances between the observations on each variable, whereas a Spearman correlation considers only whether there are differences, regardless of their size.
Both bivariate correlations and correlations partial to GDP were measured, because previous studies in other countries showed that GDP was highly positively related to social cohesion (Dragolov et al, 2016; Bertelsmann Stiftung, 2018). Generally, the more prosperous a society is, the more cohesive it is. Partialling GDP out of a relationship removes the “halo effect” – the influence of GDP on both variables involved. This makes it possible to speak of associations between a given structural characteristic of the provinces and social cohesion, independent of their economic prosperity.
4.2 RESULTS
Table 4.1 (overleaf) documents the relationships between the structural characteristics of the nine provinces and social cohesion per thematic field.
Table 4.1: Structural characteristics and social cohesion in South African provinces

Note: The table shows Spearman correlations (bivariate and partial for GDP) between the overall index of social cohesion and structural characteristics of the provinces, performed on the level of the provinces (N = 9). Significance of the coefficients in a two-sided test: p ≤ .10, * p ≤ .05, *** p ≤ .01.
5. INDIVIDUAL EXPERIENCES OF SOCIAL
COHESION
This section looks at the data at the level of individual respondents to explore which population or societal groups are at risk of experiencing low cohesion in South Africa. This exercise involved the identification of distinct groups – or classes – of respondents, based on their scores on the nine dimensions of social cohesion.
5.1. DATA AND METHODOLOGY
To classify respondents into groups with distinct experiences of cohesion, we used Latent Class Analysis. “Latent Class Analysis (LCA) is a statistical procedure used to identify qualitatively different subgroups within membership who often share certain outward characteristics. The assumption underlying LCA is that membership in unobserved groups (or classes) can be explained by patterns of scores across survey questions, assessment indicators, or scales” (Weller et al., 2020). The classes of respondents resulting from the analysis are characterised by similarities within the class and dissimilarities across the classes concerning the experience of the nine aspects of cohesion by the respondents who belong to each class. It is also possible to relate class membership to socio-demographic and socio-economic characteristics and investigate how the experience of social cohesion is related to individual characteristics.
The Latent Class Analysis produced a best fit for four classes of South Africans[8]:
Critics, 15.5% of the adult population,
Integrated Sceptics, 22.5% of the adult population,
Middle South Africa, 48.2% of the adult population, and
Cohesive Communities, 13.8% of the adult population.
5.2. IDENTIFYING FOUR CLASSES OF EXPERIENCE OF
SOCIAL COHESION
Critics (Class 1) are characterised by high identification (like all groups) but critically low acceptance of diversity. They also have low trust in people and in institutions and their perception of fairness and respect for social rules lag behind. This group has the lowest overall social cohesion index score at 40.6.
Integrated Sceptics (Class 2) show well-knit social networks, they have high trust in people and accept diversity, experience solidarity and helpfulness and participate in civic life. Like all South Africans, they agree strongly with the country. However, they fall short on trust in institutions (they are “sceptics”, after all) and exhibit very low levels of respect for social rules and perceptions of fairness. This group has the second-highest overall cohesion index score at 56.5.
Middle South Africa (Class 3) is the biggest group and also the most like the “average South African”, if something like that existed. They identify strongly with the country and have high solidarity and helpfulness when it comes to society. But, for all the other dimensions, their views are somewhere in the middle. This group has the second-lowest overall social cohesion index score at 55.7.
Cohesive Communities (Class 4) characterise the ideal-typical model of strong cohesion in South Africa, manifesting itself in exceptionally high identification and high scores on all the other dimensions. This group has the highest overall social cohesion index score at 73.4.
A series of chi-square tests of independence suggest that these four classes differ along core socio-demographic and socio-economic characteristics.
Table 5.1: 2025 Results: Social Cohesion Dimensions and LCA

Note: The table shows the average score (M) and the standard deviation (SD) of the overall index of social cohesion and its nine dimensions in the four classes of respondents. Scores below 20 are highlighted in red, scores between 20 and 39.99 are highlighted in orange, scores between 40 and 59.99 are highlighted in yellow, scores between 60 and 79.99 are highlighted in green, and scores above 80 are highlighted in blue.
A closer look at the average scores of the four classes on the nine dimensions reveals the aspects of cohesion along which the classes differ from each other (see Table 5.1 above). It is clear that all four classes exhibit a high to very high level of identification. There is also more convergence than in previous studies on the dimension of solidarity and helpfulness, with three of the four classes now exhibiting good scores. (This dimension stayed at about the same level for Critics in 2025 as in 2024.)
5.3. SOCIO-DEMOGRAPHICS OF THE FOUR CLASSES
In this section, the typical individual characteristics for the four classes are explored. As illustrated in Table 5.2 overleaf, socio-demographic and socio-economic characteristics are used. The four classes are characterised in the framework of separate chi-square tests of independence between respondents’ class membership and the respective individual characteristics of interest. Table 5.2 documents the population weighted relative frequencies (%) of the socio-demographic and socio-economic categories in the total sample and in each of the four classes as well as the respective results from the chi-square tests of independence and Cramer’s V coefficient of effect size. Due to the large sample sizes in three of the classes, all nine tests emerged as statistically significant, although some effect sizes are small.
Critics include an overproportion of single young females, with four out of five from the black population group – with home languages corresponding to this finding. They mainly live outside of metropolitan areas, and their education reflects a similar pattern to that of the country, with a slight overproportion of individuals with a lower education. Just over four in ten Critics are unemployed, leading to an effect on personal income. As we have seen in the previous section, the Critics group are not experiencing low levels of social cohesion in the country and their communities.
We have seen that Integrated Sceptics experienced a much higher level of social cohesion. This group tend to be slightly older than the first and display a slight overrepresentation of whites and coloureds than the general South African population. They also come more from married relationships and include an overrepresentation of Afrikaans-speakers, and proportionally more of them live in rural areas. The spread of Integrated Sceptics over the categories of education, working status and income is broadly similar to the general South African patterns.
Middle South Africa – exactly as the name says, this group mainly follows a distribution in different socio-demographic and socio-economic groups similar to the general South African population. If anything, this group is slightly overrepresented in the black population and live more in metropolitan areas than the general population.
Cohesive communities are more male than female and have stronger representation in the 25-to-64 age group than the general population. They show a good spread of home language and population groups but are overrepresented in the Indian/Asian group and almost half live in rural areas or villages. They are overrepresented in the group with secondary education, and are mostly employed, with corresponding higher than average incomes. They experience the highest level of social cohesion of all four groups.
Table 5.2: Socio-demographic and -economic characteristics of the four classes of respondents


Note: The table shows the population-weighed relative frequencies (%) of the categories of the pertinent socio-economic and demographic characteristics in the total sample (N = 3456) and in each of the four classes of respondents (n1 = 532, n2 = 808, n3 = 1637, n4 = 479), the respective result from a chi-square test of independence between the characteristic and class belonging, and Cramer’s V coefficient of effect size. Significance of the estimates in a two-sided test: p ≤ .10, * p ≤ .05, *** p ≤ .01.
6. SOCIAL COHESION AND SUBJECTIVE
WELL-BEING
In this section, we check whether the data support the consistent findings from previous studies that high levels of social cohesion are related to greater (subjective) well-being.
Five items from the Khayabus study are used as proxies of well-being, namely:
Think of the way your family lives, would you say that your family is … better off than a year ago / about the same / worse off than a year ago?
And how do you think your family’s lives will be in a year’s time? Do you think your family will be … better off than today / about the same / worse off than today?
Please think about your children or the children of family or friends. What do you think the future holds for these children? Do you think that … they have a bright future ahead of them / they have a bleak future ahead of them?
And your satisfaction with life? Has it … improved / stayed the same / worsened compared to a few months ago?
On a scale from 1 to 5 please indicate whether you (1) strongly disagree, (2) disagree, (3) neither agree nor disagree, (4) agree, or (5) strongly agree with the following statement: I am seriously considering emigrating to another country in the next year or so.
Analyses on both the level of provinces and of individuals were conducted.
6.1. PROVINCES – DATA AND METHODOLOGY
We aggregated individual responses to the five items to measure well-being on the level of provinces. For each province, we took the respective share of the positive response option for each of the four items with categorically scaled answers (better off, bright future, improved). We applied the same methodological approach as in Section 4, which explored associations between several structured characteristics of the provinces and the index of social cohesion. Appendix B documents the biserial bivariate correlations on the individual level and the bivariate and partial Pearson correlations on the level of provinces. As in Section 4, we report and interpret the results from the Spearman correlations partial for GDP.
Table 6.1: Social cohesion and subjective well-being in the provinces

Note: The table shows Spearman correlations (bivariate and partial for GDP) between the overall index of social cohesion and aspects of subjective well-being on the level of the nine provinces (N = 9). Significance of the coefficients in a two-sided test: p ≤ .10, * p ≤ .05, *** p ≤ .01.
These correlations are less strong than those measured in previous studies.
6.2. INDIVIDUALS
To investigate the association between social cohesion and subjective well-being on the individual level, we relate the individual responses to the well-being items to respondents’ membership in the four distinct classes of experiencing social cohesion. As most of the items on well-being are of categorical measurement quality, we apply the approach from Section 5 to describe the four classes based on respondents’ socio-demographic and socio-economic characteristics. The individual experience of social cohesion exhibits strong associations with all four of the indicators of subjective well-being.
Table 6.2: Subjective well-being in the four classes of respondents

Note: The table shows the population-weighed relative frequencies (%) of the responses to the pertinent aspect of subjective well-being in the total sample (N = 3456) and in each of the four classes of respondents (n1 = 532, n2 = 808, n3 = 1637, n4 = 479), the respective result from a chi-square test of independence between the aspect of well-being and class belonging, and Cramer’s V coefficient of effect size. Significance of the estimates in a two-sided test: p ≤ .10, * p ≤ .05, *** p ≤ .01.
The evidence presented a clear picture. The greatest share of respondents who evaluated their family’s life as better off than a year ago was found in Class 4 (Cohesive Communities). Looking at the two measures of optimism, we found similar evidence. The largest share of respondents believing that their family’s lives would be better off in a year’s time than at the time of the fieldwork, was again found in the Cohesive Communities. Likewise, optimism related to the future of children was also found to be highest in Class 4, and the pattern holds for satisfaction with life, with almost half of Group 4 claiming that their life satisfaction had improved.
In each case the optimism and hope of Cohesive Communities was shared by smaller proportions of Group 3 (Middle South Africa) and by even smaller proportions of Group 2 (Integrated Sceptics).
Group 1 (Critics) in many cases did not strongly express themselves – either positively or negatively – but largely chose the middle options of “stayed the same” when this was offered. In the case of the future of children, where no middle option was offered, more than half of Critics chose the option that children would have a “bleak future”.
7. CONCLUSION AND THE WAY FORWARD
The concept and reality of Social Cohesion should form part of the central discussion in a diverse developing country like South Africa. Thus, this project, which has developed over five years of intense studies and modelling, can contribute constructively to the intensifying and necessary discourse. Looking at the project over the five years, it is possible to see the progress made so far, but also to see what still needs to be done. For instance, the “Critics” group are seriously lagging in positive opinions about themselves and the future of the country. Special attention should be paid to developing a programme to help them see the way out of the dire situations they find themselves in. This group is mainly made up of young women, and it should be possible to mobilise NGOs and the Department in the President’s office that pays special attention to women to concentrate on this group – in a way that can be informed by the findings of this project and measured in future.
However, it would be wrong not to pay any attention to the other three groups: “Integrated Sceptics”, “Middle South Africa” and “Cohesive Communities”. These groups can perhaps be more easily addressed and involved in Social Cohesion programmes, however, it should be noted that the messages designed for each of these groups must be different. They still exhibit very different “group personalities”, have different interests, and support or are concerned about different issues. In this case, some further study and careful planning will be appropriate.
As mentioned at various instances in this report, the glue that holds the South African society together consists to a significant extent of the high level of identification with the country, as illustrated by all four groups/classes of South Africans. This national pride cannot be taken for granted. Today, it rests to a large degree on the shared connection to the country, its history and its people and the sense of belonging we share, and it also finds expression in the shared joy experienced at the success of our sports teams. But this cannot be all; other elements of “nation-building” also need to be identified, built on and shared. Looking at other areas we can develop, South Africans largely share a strong feeling of solidarity and helpfulness when it comes to fellow citizens, and relatively well-functioning social networks. These aspects can aid in the nation-building project.
On the other hand, serious political and planning attention must also be paid to the widely perceived lack of respect for social rules, as this can easily spark turmoil and unrest. Policymakers might also consider overcoming the perceived lack of fairness of various elements of the political system, likewise, strengthening of the acceptance of diversity is also needed, and trust in institutions needs urgent attention – especially with a view to the coming local government elections.
It also has to be mentioned that overall Social Cohesion in the country has increased over the last two measurement periods and that it is at an overall higher level than 2021 – thus, slow progress has been made. But it is still on a rather moderate level of 56, and is still falling far short of the hope, attitude of reconciliation and common vision of the “Rainbow Nation” of 1994. A lot of work still needs to be done.
To increase the use of this report and aid planning for Social Cohesion development, the report contains a lot of information specifically aimed at each of the provinces. On the one hand it is important to promote social cohesion on a national level, but on the other, each province also displays its own idiosyncrasies and legitimate findings and issues. The overall direction of the Social Cohesion plan should therefore include a separate special focus on each province. It would also be possible to link and disaggregate the analysis of the four groups of South Africans to each province, in order to facilitate the employment of the same building blocks in provinces as on the national scale.
The fifth study in this series really proves the stability and usefulness of the study overall and corroborates the fact that the quality of a society (its social cohesion) translates directly into citizens’ quality of life (measured by subjective well-being) – and their optimism for the future. In turn, this can improve political participation, a sense of belonging, participation in the economy, the health of communities, and even the paying of taxes!
APPENDICES
APPENDIX A: INDICATORS OF COHESION ACROSS TIME
This Appendix documents the population-weighted relative frequencies of the response categories of the indicators used to calculate the social cohesion scores in this report. The reported values pertain to the respective percentage distributions in the total sample for each year of data collection.
Table A.1: Dimension 1.1 – Social networks results over time

Table A.2: Dimension 1.2 – Trust in people results over time

Table A.3: Dimension 1.3 – Acceptance of diversity results over time

Table A.4: Dimension 2.1 – Identification results over time

*values stem from Khayabus 2020 - Wave 1 (N = 3758).
Table A.5: Dimension 2.2 – Trust in institutions results over time
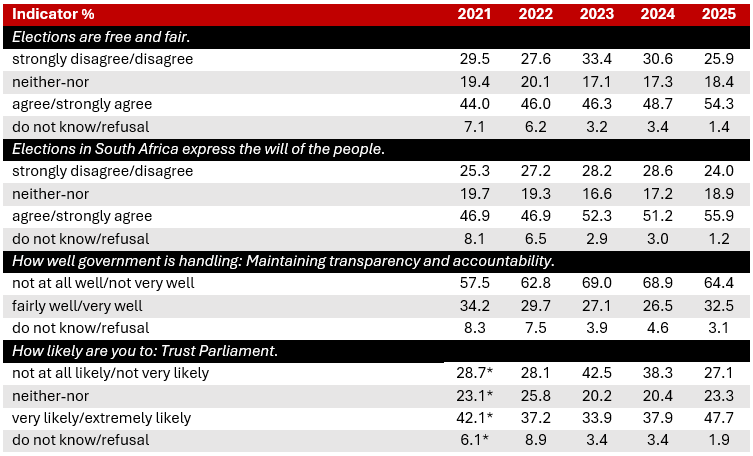
*values stem from Khayabus 2020 - Wave 1 (N = 3758).
Table A.6: Dimension 2.3 – Perception of fairness results over time

Table A.7: Dimension 3.1 – Solidarity and helpfulness results over time

Table A.8: Dimension 3.2 – Respect for social rules results over time

Table A.9: Dimension 3.3 – Civic participation results over time

* values stem from Khayabus 2020 - Wave 1 (N = 3758).
APPENDIX B: CORRELATIONS OF SOCIAL COHESION ON THE PROVINCE LEVEL
Table B.1: Structural characteristics and social cohesion in South African provinces

Note: The table shows the Pearson and Spearman correlations (bivariate and partial for GDP) between the overall index of social cohesion and structural characteristics of the provinces, performed on the level of the provinces (N = 9). For comparison, the table further shows the biserial correlations on the level of individuals (N = 3172). Significance of the coefficients in a two-sided test: p ≤ .10, * p ≤ .05, *** p ≤ .01.
Table B.2: Social cohesion and subjective well-being in the provinces

Note: The table shows the Pearson and Spearman correlations (bivariate and partial for GDP) between the overall index of social cohesion and aspects of subjective well-being on the level of the nine provinces (N = 9). For comparison, the table further shows the biserial correlations on the level of individuals (N = 3172). Significance of the coefficients in a two-sided test: p ≤ .10, * p ≤ .05, *** p ≤ .01.
APPENDIX C: LATENT CLASS ANALYSES
This Appendix documents goodness-of-fit indices for the various LCA models specified.
Table C.1: Goodness-of-fit indices of LCA solutions

Note: The table documents goodness-of-fit indices of the different solutions from latent class analysis. AIC: Akaike Information Criterion. BIC: Bayesian Information Criterion. saBIC: sample-size-adjusted Bayesian Information Criterion. APCM: Average Probability of Class Membership.
Table C.2: Relative class sizes for LCA solutions

Note: The table shows the population-weighed relative sizes of the classes (% of total sample) for different solutions from Latent Class Analysis. Percentages may not sum row-wise up to 100 due to rounding errors. N = 3172.
REFERENCES
Abrahams, C. 2016. Twenty years of social cohesion and nation-building in South Africa. Journal of Southern African Studies, 42(1), 95–107. http://www.jstor.org/stable/43900558
Alesina, A., Devleeschauwer, A., Easterly, W., Kurlat, S. & Wacziarg, R. 2003. Fractionalization. Journal of Economic Growth, 8, 155–194. https://doi.org/10.1023/A:1024471506938
Apraku, A., Moyo, P. & Akpan, W. 2018. Coping with climate change in Africa: an analysis of local interpretations in Eastern Cape, SA. Development Southern Africa, 36(3), 295–308. https://doi.org/10.1080/0376835X.2018.1482199
Arant, R., Dragolov, G. & Boehnke, K. 2017. Sozialer Zusammenhalt in Deutschland 2017. Gütersloh: Bertelsmann Stiftung.
Arant, R., Larsen, M. & Boehnke, K. 2016. Sozialer Zusammenhalt in Bremen. Gütersloh: Bertelsmann Stiftung.
Ballantine, C., Chapman, M., Erwin, K. & Maré, G. (Eds.). 2017. Living together, living apart? Social cohesion in a future South Africa. South Africa: University of KwaZulu-Natal Press. http://www.ukznpress.co.za/?class=bb_ukzn_books&method=view_books&global%5Bfields%5D%5B_id%5D=496
Bertelsmann Stiftung (Ed.). 2018. What holds Asian societies together: Insights from the Social Cohesion Radar. Gütersloh: Bertelsmann Stiftung.
Boehnke, K., Berrueto, A., Dragolov, G. & Ocampo Villegas, P. 2019. Are value preferences and social cohesion interconnected? The case of Mexico. Acta de Investigación, 9(2). http://dx.doi.org/10.22201/fpsi.20074719e.2019.2.262
Boehnke, K., Dragolov, G., Arant, R. & Unzicker, K. 2024. Gesellschaftlicher Zusammenhalt in Deutschland 2023. Gütersloh: Bertelsmann Stiftung.
Burns, J., Hull, G., Lefko-Everett K. & Njozela, L. 2018. Defining social cohesion (SALDRU Working Paper 216). Cape Town: SALDRU, UCT.
Centre for Risk Analysis (CRA). 2023. Assets and Incomes. Johannesburg: Centre for Risk Analysis.
Delhey, J. & Boehnke, K. 2018. Conceptualizing social cohesion in Asia, In Bertelsmann Stiftung (Ed.), What holds Asian societies together: Insights from the Social Cohesion Radar (pp. 29-48). Gütersloh: Bertelsmann Stiftung.
Delhey, J., Dragolov, G. & Boehnke, K. 2023. Social Cohesion in International Comparison: A Review of Key Measures and Findings. Kölner Zeitschrift für Soziologie und Sozialpsychologie, 75, 95-120. https://doi.org/10.1007/s11577-023-00891-6
Dragolov, G., Ignácz, Z. S., Lorenz, J., Delhey, J., Boehnke, K. & Unzicker, K. 2016. Social cohesion in the Western world. What holds societies together: Insights from the Social Cohesion Radar. Switzerland: Springer International. https://doi.org/10.1007/978-3-319-32464-7
Global Data Lab. 2024. Subnational HDI (v8.0). [Online] Available at: https://globaldatalab.org/shdi/table/shdi/ZAF/ [accessed: 24 September 2024].
Langer, A., Stewart, F., Smedts, K. & Demarest, L. 2017. Conceptualising and measuring social cohesion in Africa: Towards a perceptions-based index. Social Indicators Research, 131, 321-343. https://doi.org/10.1007/s11205-016-1250-4
Larsen, M. M. & Boehnke, K. 2016. Measuring Social Cohesion in the Kyrgyz Republic. Social Cohesion Index. University of Central Asia's Institute of Public Policy and Administration Working Paper No. 36, Bishkek.
Leininger, J., Burchi, F., Fiedler, C., Mross, K., Nowack, D., von Schiller, A., Sommer, C., Strupat, C. & Ziaja, S. 2021. Social cohesion: A new definition and a proposal for its measurement in Africa (Discussion Paper 31/2021). Bonn: Deutsches Institut für Entwicklungspolitik (DIE). https://doi.org/10.23661/dp31.2021.v1.1
OECD. 2021. Old-age income inequality. In Pensions at a Glance 2021: OECD and G20 Indicators. Paris: OECD Publishing. https://doi.org/10.1787/d1a5a309-en
Schiefer, D. & van der Noll, J. 2017. The essentials of social cohesion: A literature review. Social Indicators Research, 132(2), 579-603. https://doi.org/10.1007/s11205-016-1314-5
Statistics South Africa. 2023a. Census 2022. Pretoria: Stats SA.
Statistics South Africa. 2023b. Quarterly Labour Force Survey. Quarter 4: 2022. Pretoria: Stats SA.
Statistics South Africa. 2024a. Estimation of regional gross domestic product for South Africa: Experimental estimates. Pretoria: Stats SA.
Statistics South Africa. 2024b. Population Estimates. Pretoria: Stats SA.
Statistics South Africa.2024c. Subjective poverty in South Africa. Findings from the General Household Surveys 2019 and 2022. Pretoria: Stats SA.
Statistics South Africa. 2025. Estimation of regional gross domestic product for South Africa: Experimental estimates. Pretoria: Stats SA.
Wasserstein, R. L., Schirm, A. L. & Lazar, N. A. 2019. Moving to a World Beyond “p < 0.05”. The American Statistician, 73(sup1), 1–19. https://doi.org/10.1080/00031305.2019.1583913
Weller, B. E., Bowen, N. K. & Faubert, S. J. 2020. Latent Class Analysis: A guide to best practice. Journal of Black Psychology, 46(4), 287–311. https://doi.org/10.1177/0095798420930932
[1] “I am a Roman citizen.”
[2] Holland, T. & Sandbrook, D. 2024. The rest is History Returns. London: Bloomsbury. p71.
[3] Factor analysis is a statistical sorting procedure that analyses the matrix of item intercorrelations to identify items with a highly similar subgroup. The various subgroups of items (called factors) allow us to assess whether or not the items were selected appropriately according to their face validity as per the different dimensions of social cohesion. An important selection criterion is the item’s factor loading, which reflects how strongly an item is correlated with the other items sorted into the given factor. Item loadings should typically exceed .40 to be seen as sufficiently high. Items exhibiting sufficiently high factor loadings were retained.
[4] In line with the customary practice in economic research and previous SASCI studies, we transform the raw values by taking their natural logarithm (ln).
[5] Individuals below the food poverty line cannot afford enough food to obtain the minimum daily energy requirement for adequate health. Individuals below the lower-bound poverty line are unable to afford both adequate food and non-food items and have to sacrifice food for essential non-food items. Individuals below the upper-bound poverty line can afford adequate food and essential non-food items. In 2022, the food poverty line was at R663, the lower-bound poverty line at R945, and the upper-bound poverty line at R1,417, according to the Centre for Risk Analysis (CRA, 2023).
[6] The Gini coefficient measures income inequality in the population as a whole: It ranges from 0 (perfect equality among all individuals) to 1 (perfect inequality, where one individual has all income). The P90/P10 ratio contrasts the income at the 90th percentile of the income distribution to the income at its 10th percentile (OECD, 2021).
[7] Fractionalisation is the probability that two randomly selected individuals are not from the same group (ethnic, linguistic, religious, etc.) (Alesina et al, 2023). The corresponding indices for ethnic/linguistic/religious fractionalisation range from 0 (all individuals are from the same ethnic, linguistic, religious group) to 1 (each individual belongs to a separate ethnic, linguistic, religious group).
[8] The names chosen for each class refers to the opinions and characteristics defining the class.
- - - - - - - - - - - - - - - - - - - - - - - - - - - - - - - - -

This report has been published by the Inclusive Society Institute
The Inclusive Society Institute (ISI) is an autonomous and independent institution that functions independently from any other entity. It is founded for the purpose of supporting and further deepening multi-party democracy. The ISI’s work is motivated by its desire to achieve non-racialism, non-sexism, social justice and cohesion, economic development and equality in South Africa, through a value system that embodies the social and national democratic principles associated with a developmental state. It recognises that a well-functioning democracy requires well-functioning political formations that are suitably equipped and capacitated. It further acknowledges that South Africa is inextricably linked to the ever transforming and interdependent global world, which necessitates international and multilateral cooperation. As such, the ISI also seeks to achieve its ideals at a global level through cooperation with like-minded parties and organs of civil society who share its basic values. In South Africa, ISI’s ideological positioning is aligned with that of the current ruling party and others in broader society with similar ideals.
Email: info@inclusivesociety.org.za
Phone: +27 (0) 21 201 1589


great explanation and easy to follow. i use instagram video download for saving educational videos.
The mobile responsiveness of https://betzambia.org/ is highly efficient. Keeping a heavy interface responsive across all smartphone browsers is a challenging UX task, but they handled it smoothly.
Mình có lần lướt đọc mấy trao đổi trên mạng thì thấy nhắc tớiشيخ روحاني nên cũng tò mò mở ra xem thử cho biết. Mình không tìm hiểu sâuرقم شيخ روحاني, chỉ xem qua trong thời gian ngắn để quan sát bố cụcرقم شيخ روحاني cách sắp xếp các mục và trình bày nội dung tổng thể. Cảm giác là các phần được trình bày khá gọn, các mục rõ ràng nên đọc lướt cũng không bị rối Berlinintim, với mình như vậy là đủ để nắm شيخ روحاني مضمون tin cơ bản rồi.
This is such an insightful and well-written post! I really appreciate the effort you’ve put into making the content both informative and engaging. It’s refreshing to read something that provides real value and clarity to readers.
For anyone navigating the funding landscape, professional Grant Writing Services can make a meaningful difference. These services specialize in identifying suitable opportunities and crafting compelling applications that align with funder expectations. By leveraging Grant Writing Services, you ensure that your proposals are clear, detailed, and impactful. This not only improves your chances of receiving funding but also helps present your ideas in the most professional manner. Investing in expert assistance can turn a good concept into a successfully funded project, making your efforts more rewarding.
Nice post and very informative! A Side Lamp Three Layer is one of those furniture pieces that brings both elegance and convenience to a room. It provides lighting while also acting as a compact storage unit. Your article gave me some great ideas for updating my bedroom décor.