
The impact of longevity on fiscal sustainability in South Africa - Part 3
- Oct 29, 2025
- 12 min read
ADDENDUMS
ADDENDUM 1
Econometric model for government revenue
Long run equation

Long run equation: graph of actual and modelled values

Cointegration text of long run equation

The hypothesis of the cointegration test is as follows:
H0: No cointegration.
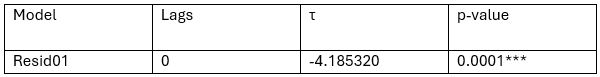
Source: Own calculations
The results indicate that the variable is statistically significant (at 1% level), which means that we can reject the null hypothesis (of no cointegration).
Short run (ECM) equation[1]


Diagnostic and Stability Tests of the ECM

Final (combined) model: actual and modelled values[2]

Forecast[3]: Base case
Assumptions (2024-2055):
CPI and Inflation: increase of 4.5% per year
GDP and RYD: Real increase of 2.0%[4] per year
RM3: Real increase of 2,1% per year (Average of last 10 years)
Prime: Decline from its current value to 9.5% per year over the next four years (until 20207), and then remain fixed at that value (9,5 based on the average of the last 10 years)
Forecast: Graph of actual and forecast

ADDENDUM 2
S1 and S2 data


ADDENDUM 3
Impact of an increase in the public sector retirement age
To mitigate some of the risks associated with longevity as highlighted in the report, this addendum looks at an additional scenario, namely an increase in the retirement age of public servants.
As far as South African legislation regarding retirement is concerned, the Public Service Act 103 of 1994[5] provides broad guidelines by stating that:
Subject to the provisions of this section, an officer, other than a member of the services or an educator or a member of the Agency or the Service, shall have the right to retire from the public service, and shall be so retired, on the date when he or she attains the age of 65 years: Provided that a person who is an employee on the day immediately before the commencement of the Public Service Amendment Act, 1996, has the right to retire on reaching the retirement age or prescribed retirement date provided for any other law applicable to him or her on that day.
According to recent news reports the National treasury stated that ‘there is no standard retirement age that is set by government in South Africa,’ and that ‘Employees in formal employment… have a retirement age that is determined by the employer and the relevant retirement fund, which is not prescribed by government.’ In addition, it confirms that ‘there are no planned changes to the old age grant – which remains available from the age of 60 for men and women’[6].
However, as far as the Government Employees Pension Fund (GEPF) is concerned, the normal retirement age for GEPF members is sixty (60) years. The fund notes that ‘The GEPF provides for normal and early retirement, as well as retirement for medical (ill health) reasons. Members whose employment have been affected by restructuring or reorganisation are also able to receive retirement benefits’ [7]. Normal retirement rules further specify that ‘benefits paid depend on whether a member has less than 10 years’ pensionable service, or 10 or more years of pensionable service. Members with less than 10 years’ service receive a gratuity – a once-off cash lump sum that is equal to their actuarial interest in the Fund. Members with 10 or more years’ service receive a gratuity and a monthly pension annuity.’
Against this backdrop, this addendum aims to quantify a scenario in which the retirement age for all public sector workers is set at 65 years of age, starting from 2025. This scenario then includes an amendment of the GEPF rules to increase the normal retirement age to sixty-five (65) years of age.
Quantum of costs
As a starting point one needs to get an estimate of the number of government employees currently in the age bracket of 60-65, as well as their earnings.
The 2022 Medium Term Budget Policy Statement (MTBPS) provided a detailed breakdown of public compensation data[8] (see Table 1). This document indicates that in 2022 around 1,308,123 individuals were employed by the public sector. By dividing the expenditure on salaries and wages by the number of employees per sector, in 2022 the average public sector employee earned R457,209 per year.
Table 1: Public-service salaries (R millions) and headcount (number), 2015-2022

Source: National Treasury, 2022 MTBPS Annexure B
Although a detail breakdown by age is not provided in the MTBPS document, a parliamentary reply by the then Public Service and Administration Minister Dlodlo stated that ‘131 176 public servants will reach the retirement age of 65 in 2025’[9].
By dividing this number of individuals, by the total number of public sector employees, gives an estimate of around 10,1%[10] of public sector employees falling within the 60-65 years age bracket[11].
To get a value for the pensionable portion of these employees, we assume an average contribution rate of 20,5% - that is 7,5% by the individual self and 13,0%[12] by the employer. By applying this ratio to the average public sector pay, gives an amount of R93 728 per year per employee. By multiplying this amount by the estimated number of individuals in the 60-65 years age bracket equates to just over R12,3 bn per year of (potential) additional retirement savings (‘contributions’) (see Table 2).
Table 2: Public service employees numbers and costs, 2022

Source: 2022 MTBPS, DPSA, compiled by author
However, there is a (significant) caveat to this scenario, that is that if members retire later, the state needs to continue to pay them their salaries up to their retirement date. Using a similar methodology as explained above, the cost to the state to continue paying individuals aged 60 to 65 years would have amounted to around R59,9 bn[13] for 2022.
To project these values over the forecast period, they need to be adjusted for inflation. Actual inflation is used for 2023-2024 after which inflation of 4.5% per year is used (the same as the assumption use throughout the longevity report[14]). We also have to assume a fixed level of employment over the forecast period.
According to the GEPF 2023/24 annual report, the value of their ‘funds and reserves amounted to R2.34 trillion on 31 March 2024 and accumulated funds and reserves grew at an average rate of 5.53% per year during the 2015 – 2024 period’[15]
To get an idea of the retirement value of additional years of service, the annual contributions are adjusted for the inflation as well as the average growth rate, reported by the GEPF. To not overcomplicate the analysis, we exclude the impact of withdrawals[16] from the fund here.
Figure 1: Additional salary costs (state) and retirement contributions and values (employees/pensioners), 2022-2055

Source: own calculations
Figure 1 indicates that, initially there exists a sizeable gap (around R48 bn) between the cost of additional salary payments of the state and the value of the accumulated retirement savings. This gap further increases to around R67 bn in 2038. However, thereafter, it is narrowed quickly to the point where the accumulated value of savings equals the additional salary expenses towards the end of the forecast period (i.e. 2054). In reality this is an ‘accounting gap’ in the sense that the state will continue to have to pay the salaries but that the gap can be seen as a proxy for the ‘value to society’ derived from individuals being able to save additionally towards their own retirement.
Impact on the model
To equate the size of the ‘GAP’ to the model applied in the report, the results are compared to the base scenario, discussed in detail in Chapter 4 of the report. Given that the 60 to 65 age cohort is in focus here, it makes little sense to also apply the longevity shock, and it is therefore excluded.
The results indicate that the budget deficit is likely to increase by around 0,5 percentage points, compared to the base scenario during the initial forecast years (i.e. around 2025 to 2040). For 2025 this is equal to a deficit of 6,6% of GDP compared to -5,9% for the base scenario. However, the difference between the GAP and base scenario is expected to gradually decline thereafter to the point where the GAP actually indicates a (marginally) smaller deficit during the final year of the forecast period.
Figure 2: Budget Balance as % of GDP (Base and Retirement GAP)

Source: SARB data, Own calculations and forecasts
As can be expected, larger annual deficits will push the debt to GDP ratio up, breaking 90% of GDP by 2037 compared the base scenario which indicates that it should remain below the 90% level. The difference between the two peaks at 5,0 percentage points around mid-2040’s after which it starts to decline to around 3,1% by the end of the forecast period.
Figure 3: Gross Debt to GDP (Base and Retirement GAP)

Source: SARB data, Own calculations and forecasts
Summary
The aim of this section is to quantify the impact of an increase in the retirement age of public servants from 60 to 65 years of age, on the fiscus.
The results indicate that this will have both a social costs (salary payments) as well as social benefit (retirement savings). Initially the costs will outweigh the benefits but over time, and given growth in the investment portfolio, this is estimated to equalise.
The impact on state finances will be a larger budget deficit and debt, especially during the initial years, that should decline over time.
ADDENDUM 4
Impact of an increase in the qualifying age for the Old Age Grant (OAG)
To moderate some of the risks associated with longevity as highlighted in the report, this addendum looks at another additional scenario, namely an increase in the qualifying age of the States Old Age social grant (OAG).
Chapter 4 of the report provided a detailed analysis of the different expenditure items, expected to be most affected by longevity. Specifically, Figure 37 showed the relative contributions of the three items to the total shock, and highlighted the dominant impact of old age grants, followed by the health services expenditure. Old age grant payments represented on average around 60% of the total combined shock to expenditure.
Chapter 3 of the main report already showed that during the 2024/25 fiscal year around 4,1 million individuals received the old age grant, and this is budgeted to rise to just below 4,5 million by 2027/28. This item represents a significant cost to the state and is also the largest (by cost) of the different social grants. The OAG cost the state R106,8 billion currently and is budgeted to increase to R131,0 billion over the next three years (that is an average rise of 7,0% per annum over the medium term).
Recent developments include that the National treasury confirmed that ‘there are no planned changes to the old age grant – which remains available from the age of 60 for men and women’[17].
Given the relevance and prominence of this social assistance related expenditure item, this addendum thus aims to quantify a scenario in which the qualifying age for all recipients of the State’s Old age social grant, is increased to 65 years of age, starting from 2026. However, this is done subject to a phased in approach over five years.
Quantum of costs
The main report already provides detailed estimates of the cost to the State of providing the OAG. As far as this addendum is concerned one needs to calculate the possible ‘saving’ if individuals falling between the ages of 60 to 64, are excluded.
According, to StatsSA, in 2024 South Africa had some 24,6 million individuals older than 60 years, while 8,6 million individuals (or roughly 32.6% of the total older than 60 years) fell in the age bracket 60-64 (See Table 1).
Table 1: South Africans aged 60 and above, 2024
| Male | Female | Total | % of Total |
60-64 | 866481 | 1134227 | 2000708 | 32.6% |
65-69 | 654162 | 921092 | 1575254 | 25.7% |
70-74 | 459581 | 697690 | 1157271 | 18.9% |
75-79 | 273676 | 471861 | 745537 | 12.2% |
80+ | 212322 | 441742 | 654064 | 10.7% |
Total | 2466222 | 3666612 | 6132834 | 100.0% |
Source: StatsSA, Mid-year population estimates, 2024[18]
Using this as a proxy, we thus assume that around 30% of AOG recipients are likely to fall within the 60-64 age bracket.
As mentioned above this analysis further assumes that the State will follow a phased in approach, that is where the qualifying age for the OAG is increased by one year per annum starting in 2026. This means that for 2026, only individuals 61 years and older will be viable to receive the grant, in 2027 only those 62 years and older, etc., thus reaching the target of 65 years from 2030 onwards.
To not overcomplicate the analysis, we assume that there are an equal number of individuals in the age cohorts 60 to 64. This translates to a linear, cumulative decline (saving) of around 6% [19]per year between 2026 and 2030. All other assumption related to the base and shocked scenarios remain the same as use in Chapter 4 of the main report.
Results
The results indicate a noticeable deviation between the base[20] and adjusted (age to 65 years) scenarios over time. During the first five years (implementation phase) the base scenario continues to rise strongly from around R106.8 bn in 2025 to R154.5 bn in 2030. In contrast to this the adjusted scenario remains largely unchanged from R106.8 bn in 2025 to R108.1 bn in 2030. This is as expected given the continued phasing out of qualifying individuals during the implementation phase.
After 2030 both series starts to rise, but with a significant gap between the series evident throughout the forecast period (see Figure 1).
Figure 1: OAG costs of base versus adjusted (age 65) scenarios, 2024 to 2055

Source: National Treasury (base up to 2028), own calculations
When comparing the results to total government expenditure, we get similar trends but with noticeable lower values for the adjusted (age over 65) scenario. Over the whole period the average for the original (shocked) scenario is around 0.5 percentage point compared to 0.3 percentage points for the adjusted (age over 65) scenario.
Figure 2: OAG shock to expenditure: impact of original (shocked) versus adjusted (age 65) scenarios, 2024 to 2055

Conclusion
The aim of this addendum is to quantify a scenario in which the qualifying age for all recipients of the State’s Old age social grant, is increased to 65 years of age. This was done by using a phase in approach over 5 years, that is from 2026 to 2030.
The results indicate a significant saving in expenditure, averaging around R25 bn per year between 2026 and 2030. This equates to some R126.1 bn over the whole 5-year period.
When comparing the results as a percentage of total government expenditure, the average value for the original (shocked) scenario is around 0.5 percentage point compared to 0.3 percentage points for the adjusted (age over 65) scenario. That means an (average) ‘saving’ of around 0.2 percentage point of total government expenditure can be realised per year if the qualifying age of the OAG is adjusted to 65 years of age.
Figure 3: OAG costs of all original versus adjusted (age 65) scenarios, 2024 to 2055

[1] All non-stationary variables have been differenced appropriately based on stationarity tests.
[2] Evident from the graph is that, in general, the model provides a good fit and trend of the actual values. Some discrepancies between the actual and modelled values are evident towards the later part (2015+). However, these are to both the upper and lower side, meaning we do not have a specific bias in the model. The large fluctuations during the Covid-19 period (2020-2021) likely further complicates the model’s ability to trace the actual values.
[3] To perform a forecast of the dependent variable (government revenue in this instance), the econometric model requires values for all explanatory variables over the forecasting period. Therefore, the need for the assumptions.
[4] This relates to the upper limit of the SARB’s potential growth rate, as discussed in Chapter 2.
[6] Daily Maverick, 27 May 2025, available at: No, there is no change to the retirement age
[8]2022 MTBPS Annexure B. Available at: https://www.treasury.gov.za/documents/mtbps/2022/mtbps.aspx
[9] https://www.dpsa.gov.za/thepublicservant/2022/03/09/govt-remains-largest-employer-in-sa-min-dlodlo/
[10] This figure is likely understated, however it is difficult to determine the exact number of retirees in each age group per year, given the Minister’s broad statement.
[11] This seems in line with other sources such as StatsSA’s Quarterly Labour Force survey, which indicates that the 55-64 years age bracket represented around 7,8 percent of the total labour force in 2025. P02111stQuarter2025.pdf.
[12] Note that this is the average rate, and that the DPSA states that the ‘rate is higher for members of the services, i.e. Police, Defence and Correctional Services. The employer contributes 16% of the member’s pensionable salary. Members of Intelligence Services also receive 16% of the member’s pensionable salary.’ https://www.dpsa.gov.za/policy-updates/nlrrm/conditions_of_service/pensions/pensions/.
[13] 131176 (individuals) x R457 209 (average pay per year)
[14] 4,5% per annum is the mid-point of South Africa’s official inflation target.
[16] The GEPF is a defined contribution pension fund meaning that it does not guarantee a specific retirement benefit. Instead, both the employee and employer contribute a certain amount to an individual account, which is then invested, and the retirement benefit depends on the performance of these investments. (Why withdrawing your pension from the GEPF could be your worst financial decision - Moneyweb).
[17] Daily Maverick, 27 May 2025, available at: No, there is no change to the retirement age
[19] 30% assumption / 5 years = 6% per year
[20] Using the shocked scenario provides very similar trends and will thus not also be discussed here. See Figure 3 at the end of the Addendum for a combined graph of all different options and scenarios.
- - - - - - - - - - - - - - - - - - - - - - - - - - - - - - - - -

This report has been published by the Inclusive Society Institute
The Inclusive Society Institute (ISI) is an autonomous and independent institution that functions independently from any other entity. It is founded for the purpose of supporting and further deepening multi-party democracy. The ISI’s work is motivated by its desire to achieve non-racialism, non-sexism, social justice and cohesion, economic development and equality in South Africa, through a value system that embodies the social and national democratic principles associated with a developmental state. It recognises that a well-functioning democracy requires well-functioning political formations that are suitably equipped and capacitated. It further acknowledges that South Africa is inextricably linked to the ever transforming and interdependent global world, which necessitates international and multilateral cooperation. As such, the ISI also seeks to achieve its ideals at a global level through cooperation with like-minded parties and organs of civil society who share its basic values. In South Africa, ISI’s ideological positioning is aligned with that of the current ruling party and others in broader society with similar ideals.
Email: info@inclusivesociety.org.za
Phone: +27 (0) 21 201 1589


I’ve found that consistency is key with Tadalafil, and that starts with knowing the safe parameters. The information regarding the "maximum dosage within a 24-hour period" eliminated any confusion I had. This resource is essential for any patient starting out. The results speak for themselves—my confidence is back, and I feel like myself again. I recommend consulting the official guide here https://valhallavitality.com/blog/understanding-the-maximum-dosage-of-tadalafil-within-a-24-hour-period to ensure compliance. This treatment has been an incredible success, all thanks to clear instructions and a great product.