
Quantifying the impact of restrictive monetary policy on the South Africa economy since 2022 (part 2)
- Dec 11, 2025
- 36 min read
SECTION B
The damage to South Africa’s economy of unduly high interest rates
It is acknowledged that a range of other obstacles to higher growth also exist in the South African economy. These are well documented and include the decay of infrastructure, the state capture of key public sector agencies under the previous head of state, high crime levels, widespread corruption and the dysfunctional state of many municipalities. When the excessive regulation of the labour market and of private sector business expansion is added to this list, it seems clear that a switch to more market-friendly policies and private sector participation in the upgrading of infrastructure is desperately needed.
It has nevertheless become apparent that record high nominal and real interest rates (despite the absence of demand inflation) have exerted a range of detrimental effects on the South African economy, especially in the key areas of output growth, capital formation, employment and the financial disposition of households. The analysis that follows illustrates the pervasive extent of the damages inflicted on the economy by the unduly restrictive monetary policy since 2022.
1 DECIMATION OF CONSTRUCTION
ACTIVITY
The Afrimat Construction Index (ACI), which captures ten key indicators of business conditions in the construction sector, took a substantial knock during the first quarter of 2025, declining by a record quarter-on-quarter margin of -13.8%. Although the year-on-year decline was more muted at 2.6%, it remains a point of concern for policy makers and the private sector value chain for construction activity that the latest reading of the ACI is the second lowest since its inception 14 years ago (see figure 20). The only quarter with a lower ACI reading was during the Covid-lockdowns in the second quarter of 2020.
Figure 20: Afrimat Construction Index (ACI) – 2nd quarter 2025

Little doubt exists over the depressing effect that record high interest rates have exerted on the construction industry, as also confirmed by several other key economic indicators, most notably exceptionally high debt-servicing ratios and a persistent decline in the real value of credit extension.
Figure 21 illustrates a common post-Covid trend encountered with a host of key indicators, namely an impressive recovery from the Covid-induced lockdowns for the volume of building materials produced, followed by a more gradual growth trend and then, as record high interest rates started to hurt the pockets and profits of millions of indebted households and businesses, a return to a declining trend.
In the case of the volume of building materials produced in South Africa, this was 10% lower in the first quarter of 2025 than in the first quarter of 2019 (pre-Covid). It is clear that the marginal declines in the prime overdraft rate since September 2024 (directly, via the SA Reserve Bank’s repo rate) have not been sufficient to exert a meaningful positive impact on construction activity.
Figure 21: Volume of building materials produced - 4 quarter average

(Sources: Stats SA; own calculations)
Although the National Treasury announced a provision of more than R1 trillion for infrastructure allocations in the 2025 Budget, a report by Industry Insights has noted that the overall construction pipeline shrunk by more than 17% during the first quarter of 2025. This trend, combined with the disappointing results of the first quarter ACI, raises concerns over the immediate future of construction activity in the country.
Figure 22: Value of construction works by the public & private sectors at constant 2025 prices

(Sources: Stats SA; own calculations)
It is no secret that a decade of state capture under the previous head of state has contributed to the inability of the public sector to reverse the decay of the country’s roads, railways, harbours and energy facilities. Apart from the debilitating effect of record high interest rates, the crux of the problem with construction sector lethargy can be found in the declining trends for the value of construction works.
Although the private sector has managed to raise its level of activity since 2008, the contributions by government at large and the state-owned enterprises remain on a long-term downward trajectory (see figure 22). Unless this trend is reversed soon, the country’s growth prospects will diminish further, as capital formation is a strong leading indicator of future economic output.
2 VALUE OF BUILDING PLANS IN FREE-
FALL
No metropolitan region in the country has escaped the debilitating effect of unduly restrictive monetary policy since 2021, as aptly illustrated by figure 22, which shows the real value of building plans passed by the metros and larger municipalities in three key provinces for the eleven months between January and December over the past four years.
Figure 23: Average monthly value of building plans passed in key provinces at constant 2025 prices

(Sources: Stats SA; own calculations)
The declines over the past two years indicate the extent to which construction sector has been decimated, with record high interest rates primarily responsible for this sorry state of affairs. These declines amount to 71%, 69% and 59%, respectively, for KwaZulu/Natal, Gauteng and the Western Cape, respectively.
Although the Western Cape bucked the negative trend in 2022, mainly due to the phenomenon of “semigration” (due mainly to superior public sector service delivery standards in the province), the higher cost of capital and credit induced by record high interest rates eliminated a significant portion of potential demand for both residential and non-residential property development.
Construction is the most labour-intensive sector in the economy, and the restrictive monetary policy of the Reserve Bank has not only prevented this sector from recovering from the Covid pandemic but has directly contributed to the sector entering a serious recession.
3 HOME LOAN APPLICATIONS STILL
DOWN ON 2021 FIGURES
An inverse correlation exists in most countries between the level of mortgage bond interest rates and the number of home loan applications by prospective home buyers. South Africa is no exception, with rather predictable trends having been experienced for home loans administered by BetterBond, one of South Africa’s largest bond originators (a similar trend occurred in the US housing residential property market).
Figure 24: Number of mortgage bond applications administered by Betterbond (indexed) & prime rate

Figure 24 illustrates the inverse relationship between the prime overdraft rate and the number of home loan applications administered by BetterBond. Although the downward trend has been arrested as a result of a marginal relaxation of the SARB’s restrictive monetary policy stance, the dire situation in South Africa’s residential property market continues to frustrate the ambitions of prospective home-owners, due to the inability of average remuneration levels to keep pace with the substantial increase in mortgage bond repayments.
The following comparison between real benchmark lending rates for home loans provides a simple explanation for the South African residential property market activity remaining in the midst of a serious recession.
The base variable home loan rate in Australia was 5.9% at the end of June 2025, with the country’s annualised consumer price index (CPI) at 2.1%, translating into a real benchmark lending rate of 3.8%.
At the end of June 2025 in the UK, the average five-year fixed-term mortgage rate for home-buyers with deposits of 15% to 25% was 4.3%. With an annualised CPI of 3.6% in June, this resulted in a real lending rate of 0.7%
In sharp contrast, South Africa’s average real benchmark lending rate between the fourth quarter of 2024 and the third quarter of 2025 was 7.9%, which was double the rate in Australia and more than ten times higher than in the UK.
The number of people applying for home loans via BetterBond between 2019 and 2021 confirms the negligible negative effect of the Covid lockdowns, with a sharp recovery in home loan applications within merely one quarter. In sharp contrast, the restrictive monetary policy that kicked in during 2022 took the wind out of the sails of the residential property market, with the BetterBond Home Loan Index for the 2nd quarter of 2025 still 28% lower than the reading in the 2nd quarter of 2022, when the higher interest rates started taking their toll on the ability of home-buyers to finance their monthly repayments. In June 2025, this index value remained 40% lower than its peak in the 3rd quarter of 2020.
With the prime overdraft rate still 350 basis points above the level of 7% that existed immediately after the Covid-19 pandemic and 50 basis points higher than the level of 10% that existed immediately before the pandemic, no meaningful recovery of home building activity can be expected this year. A point of particular concern is a recent suggestion by the MPC that a so-called “uncertain global outlook” could halt the rate-cutting cycle, as well as the apparent assumption that the South African currency was bound to depreciate substantially against the US dollar. It seems that the MPC is forever trying to find new reasons to keep interest rates high, at the detriment of economic growth and employment creation.
4 AVERAGE HOME PURCHASE PRICES IN
DECLINE
Declines in the prime overdraft rate since the second half of 2024 have assisted a marginal rise in average home prices since the 4th quarter of 2023. However, this trend was arrested during the 2nd quarter of 2025, when average home prices declined (year-on-year) for both first-time buyers and repeat buyers whose mortgage bonds are administered by BetterBond.
Since the 1st quarter of 2022, when the restrictive monetary policy of the SARB kicked in, average house prices for first-time buyers have declined by 8.3%. The negative effect on house prices due to the relentless rise in interest rates have impacted on every age group of home-buyers. Over the past two years, the decline is average real house prices for buyers whose mortgage bonds are administered by BetterBond decreased by between 3.3% and 5% for different age groups, as illustrated by figure 26.
According to informal surveys amongst real estate agents, a significant proportion of home sales are as a result of financial difficulty experience by home-owners, who are forced to sell their properties due to the inability to service the debt costs. The purchase of a home is the single most expensive expenditure of most people employed in the formal sector of the economy. The expansion of home ownership is also regarded as a bastion of socio-economic stability, as a home represents a place of security and shelter for families. In time, the appreciation of the value of a home also serves as collateral for upgrading to a more convenient residence or neighbourhood, but this fortuitous cycle has been put into reverse by very high interest rates in recent years.
Figure 25: Average home purchase price by age group at constant 2024 prices

(Source: BetterBond)
5 FINANCIAL RESILIENCE OF
HOUSEHOLDS UNDER PRESSURE
Since 2022, the results of the Altron FinTech Household Resilience Index (AFHRI) have confirmed the continued financial pressure on South African households, mainly due to the restrictive monetary policy stance by the MPC. This index is comprised of 20 different indicators, weighted according to the demand side of the short-term lending industry and calculated on a quarterly basis.
Figure 26: Nominal prime rate & average real monthly remuneration of employees

(Note: 4-q avg. salaries)
(Sources: Stats SA; SARB)
With the exception of two indicators (household expenditure & short-term insurance premiums paid), the other 18 indicators all have a bearing on income received from various sources or future income receipts (such as financial or tangible assets). The most important of these income sources are formal sector salaries, which took a hefty knock as a result of the restrictive monetary policy stance between 2022 and the end of 2024.
The inverse relationship between average salaries in the formal sectors (at constant prices) and the benchmark lending rate between mid-2021 and the 4th quarter of 2024 is illustrated by figure 26. Fortunately, the lowering of the prime lending rate since September 2024 has led to a modest recovery of the average real formal sector salary, but it remains significantly lower than the 3rd quarter of 2021 – just before the interest rate hiking cycle commenced.
6 THE PLIGHT OF THE SMALL BUSINESS
SECTOR
6.1 SMEs struggle to access sufficient credit
Small and medium-sized enterprises (SMEs) play a crucial role in driving economic growth and employment opportunities, particularly in emerging market economies (EMEs) such as South Africa. The significance of SMEs in South Africa’s economy is clear from the finding by National Treasury (2021) that the small business sector is responsible for more than half of the country’s total employment and Gross Domestic Product (GDP).
Unfortunately, one of the major hindrances to credit access for SMEs in South Africa is the relatively high cost of credit, compared to other emerging markets, with interest rates on SME loans ranging from 10% to 30% per annum (OECD, 2020). Since the latter finding was published, matters got considerably worse, with an increase in the nominal prime lending rate of 68% having occurred between the third quarter of 2021 and the third quarter of 2023. South African SMEs also encounter significant challenges in accessing adequate financing, particularly when it comes to credit (Fubah & Moos, 2022). The level of the reigning commercial lending rate plays a pivotal role in determining the cost of credit, impacting the ability of SMEs to borrow, invest, and ultimately grow (Tran et al., 2020).
An investigation into the effect of interest rates on credit access for small and medium-sized enterprises (SMEs) in South Africa, conducted by Msomi (2023) found a clear indication of a negative correlation between interest rates and the ability of SMEs to access credit. This negative correlation was substantiated through both linear regression analysis and the Pearson correlation coefficient methodology. The study recommended that policy makers in South Africa should consider reducing interest rates and relaxing collateral requirements to improve credit access for SMEs.
6.2 Majority of SMEs in distress
The plight of SMEs in the quest to finance the expansion of their businesses has also been highlighted by the results of the Absa/SACCI Small Business Growth Index (SBGI). The Index is jointly researched by Absa, the South African Chamber of Commerce and Industry (SACCI) and Unisa’s Bureau of Market Research (BMR). It is based on a survey conducted between April and May 2025 and serves as an up-to-date barometer for policymakers, providing insights into small business conditions, challenges and growth prospects.
The Index found that SMEs were experiencing difficulty in remaining solvent, due to the weight of rising costs. Transport and fuel costs delivered the hardest blow, with more than 66% of SMMEs reporting increases. Cost pressures are perceived as severe and widespread across sectors. Unsurprisingly, the record high interest rates during 2022 to the end of 2024 have also taken their toll, with almost 60% of respondents having experienced an increase in the cost of borrowing (see figure 27). A total of 60% reported weak or critical cash flow, and only 2.8% described it as strong. Almost one in five flagged their current debt levels as “unmanageable or very concerning” and more than half of small businesses in South Africa are in decline or in distress.
Figure 27: % of SMMEs that have experienced increases in key costs of doing business - 2nd quarter 2025

(Source: Absa/SACCI/BMR Survey)
A total of 52.8% of small, medium and micro enterprises (SMMEs) are in a state of contraction, difficulty, or risk of closure, with nearly one in 10 facing potential closure, as illustrated by figure 28. Other findings include:
More than 55% of SMMEs said they might not make another year without relief. To stay afloat, more than three-quarters plan to hike prices in the next six months.
Almost one in five flagged their current debt levels as “unmanageable or very concerning”.
Only 60% use any formal finance instruments, with the others relying instead on personal savings or informal networks.
Figure 28: SMME survival outlook

(Source: Absa/SACCI/BMR Survey)
The implications of these findings are alarming, as it means that the key engine of entrepreneurship and job creation is buckling under undue pressure, especially in the area of borrowing costs, due to the record high interest rates between 2022 and 2024. A struggling SME sector slows down overall economic growth, affecting the livelihoods of millions of South Africans.
7 SHARP INCREASE IN HOUSEHOLD
DEBT COSTS
In the first quarter of 2022, households were sacrificing 6.7% of their disposable incomes to pay for debt costs. Over the subsequent seven quarters, this ratio increased by 39%, with households having to spend 9.3% of their disposable incomes on servicing the interest on debt repayments by the end of 2023 (see figure 29). Although this ratio has declined marginally as a result of a lowering of interest rates since the third quarter of 2024, it remains 33% higher than three years earlier.
Figure 29: Household debt costs as % of disposable income

(Source: SARB)
According to Johan Gellatly, the Managing Director of Altron Fintech, the restrictive stance of monetary policy remains a point of huge concern for millions of indebted households and businesses. In a media statement published on 16 July 2024, he notes that, despite inflation having moved to a comfortable level of close to the lower point of the Reserve Bank’s target range of 3% to 6%, the MPC’s dogged insistence to maintain a real prime rate of between 6% and 8% defies logic, as this rate is now 158% higher than the average real prime rate that existed in 2014, just before the retirement of Gill Marcus, the previous Governor of the Reserve Bank.
Gellatly believes that the standard of living of South African households will not be lifted unless interest rates decline to substantially lower levels. Various key indicators of economic activity in South Africa, the AFRHI included, clearly paint a picture that, in order to start assisting consumers, interest rates must be lowered. This is equally important in terms of growing the economy, attracting investment, and reducing unemployment. More and more, one has the impression that Business SA is sitting on the sidelines and playing a ‘wait-and-see game’ to ascertain whether they should invest or not due to the high cost of capital investment.
When households are forced to commit a larger percentage of their disposable incomes to the servicing of debt costs on mortgage loans and other credit instruments, it follows ceteris paribus that their disposable incomes will decline. In the absence of meaningful growth in formal sector employment levels, this truism will also hold for the economy as a whole. Figure 30 illustrates this predictable inverse correlation, which has resulted in very low levels of household expenditure – the most important component of aggregate demand in the economy.
Figure 30: Logarithmic trend lines for real disposable income & debt cost/income ratio of households

(Sources: SARB; own calculations)
8 INFERIOR GDP GROWTH TO EMERGING
MARKET PEERS
Since 2020, real global growth has only averaged 2.55%, with South Africa lagging quite far behind, especially within its peers in the EMDEs. Since 2020, average annual real GDP growth in EMDEs amounted to 3.7%, compared to a paltry 0.4% in South Africa (see figure 31).
Although the resultant fiscal strain was caused by several factors, including state capture, which rendered several key state-owned enterprises incapable of properly maintaining the country’s logistics and energy infrastructure, the substantial increase in real interest rates before and after the Covid-19 pandemic also took a heavy toll.
It should be pointed out that a study published by the Inclusive Society Institute (2023) found that, by international standards for EMDEs, South Africa boasts an extensive and progressively targeted social support programmes (SWS), which has grown to one of the largest in the developing world, with the growth in the number of people receiving grants having increased from 2.4 million in 1998 to an estimated 28 million in 2025 – an increase of more than ten-fold.
Figure 31: Real GDP growth - South Africa and Emerging Market & Development Economies

(Sources: World Bank; Statistics SA)
Utilising general household income and expenditure data, Bhorat & Cassim (2014) found that grants managed to stabilise annual household real income growth between 1995 and 2010. In the absence of social grants, real household income would have declined for those in the 2nd and 3rd lowest income decile by 12% and 7% per annum, respectively.
Due to several years of low GDP growth, the expenditure related to maintaining the grant system and other social welfare policies has placed considerable pressure on the National Treasury. According to the National Treasury, the social wage has reached a level of approximately 50% of consolidated government spending. It has become imperative to alleviate fiscal pressures, in order to ensure the affordability of grants to unemployed people and pensioners. To this end, considerably lower interest rates can play an invaluable role to lift the GDP growth rate.
9 AGGRAVATION OF INCOME
INEQUALITY
Measured by the Gini coefficient, which is widely used to determine the wealth or income inequality in a country, South Africa is ranked as having the lowest level of income equality in the world. Abundant literature confirms the positive impact of employment creation on achieving a more balanced level and higher level of income and wealth distribution, including research by Zore (2024), Schoeman (2025) and Fortuin, et al. (2022),
The mathematics underpinning the important role of employment creation in lowering income inequality is straightforward. In virtually every developing country, including South Africa, social security programmes (SSPs) are the domain of government, especially those related to welfare payments. For every formal sector job that is created via relevant macroeconomic policies, the fiscal authorities benefit in two ways: Firstly, there is one less grant that needs to be paid and, secondly, there is one more taxpayer that contributes to the fiscal resources necessary to implement SSPs.
It stands to reason that a central bank, as the implementing agency for monetary policy, wields considerable influence over an economy’s ability to match growth and employment creation policies with the overall priority afforded to a government’s economic policy objectives. In this regard, it is illuminating to consider the recent research by Zore, which examined the causal effect of monetary policy on income inequality in emerging economies using a dynamic panel analysis with the Generalised Method of Moments (GMM). The sample consisted of 46 emerging economies (including South Africa) from 2000 to 2018.
The results indicate that restrictive monetary policies contribute to an increase in income inequality. It is noted that these policies have a minimal impact on income distribution until the third year after their implementation, indicating a delayed effect on inequality.
Fortuin et al. (2022) examined how macroeconomic policies influenced income inequality in South Africa over the period 2010 to 2019 using a behavioural life-cycle model. The results show that the South African government’s current policy model to redirect income via grants from a very small tax base is unable to meet income redistributive targets. A key recommendation is that government should rather switch to creating an environment in which private enterprises are able to absorb the labour capital that South Africa possesses. An open labour market would support private and foreign direct investment into the economy, thereby strengthening economic growth and upliftment through increased income and the consequent ability to accumulate wealth.
Monetary policy entails a choice over which objective is more important – low inflation or job creation via incentivising higher levels of capital formation and economic growth. Under the current socio-economic circumstances and based on the evidence provided in this section, it seems clear that the monetary authorities have neglected the latter policy objective by maintaining an elevated real interest rate over the past decade – at a huge cost that includes growing unemployment and a higher level of income inequality.
10 LOWER UTILISATION OF
MANUFACTURING CAPACITY
South Africa provides a useful case study of a third instance where restrictive monetary policy can exacerbate supply-side inflation, namely where higher interest rates lead to lower demand for manufactured goods. The latter, in turn, leads to a decrease in capacity utilisation, thereby increasing the fixed costs per unit of production.
The growing level of unutilised capacity in South Africa’s manufacturing sector constitutes a further indictment of the country’s overly restrictive monetary policy. Capacity utilisation in this key sector has not yet recovered to pre-Covid levels. A declining trend in this indicator kicked in between the third quarter of 2013 and the end of 2018, mainly due to the negative effects of state capture and infrastructure inefficiencies but has since worsened as a result of lower demand induced mainly by record high interest rates (see figure 32).
Figure 32: Capacity utilisation in manufacturing remains lower that pre-Covid

(Source: Statitics SA)
A modest recovery ensued immediately after Pres Ramaphosa’s assumed the country’s highest office in 2018, but progress was thwarted by the Covid pandemic and, subsequently by record high interest rates, which dampened demand in the economy via a sharp increase in debt servicing costs. Between the first quarter of 2019 and the first quarter of 2025, capacity utilisation in manufacturing has declined by 6%.
Figure 33: Share of insufficient demand in cause of unutilised capacity in manufacturing

(Note: 4-Q avg)
(Sources: Statistics SA; own calculations)
The adverse impact of restrictive monetary policy on demand in the economy is confirmed by its dominant role in declining capacity utilisation. This trend has also served to aggravate inflation via raising the fixed overhead costs per unit in the manufacturing sector, which means that the country’s restrictive monetary policy has been damaging the economy via self-inflicted upward pressure on cost-push inflation.
This statement is vindicated by the fact that insufficient demand for manufactured products remains the most important reason for the presence of a significant level of unutilised capacity in South Africa’s factories. During the second quarter of 2025, a lack of sufficient demand was responsible for more than 52% of the unutilised capacity in manufacturing – an increase in the share of this impediment to manufacturing production of 7.9% since the third quarter of 2022, when the persistent increase in the repo rate (and the prime rate) started to take its toll on dampening demand in the economy (see figure 33).
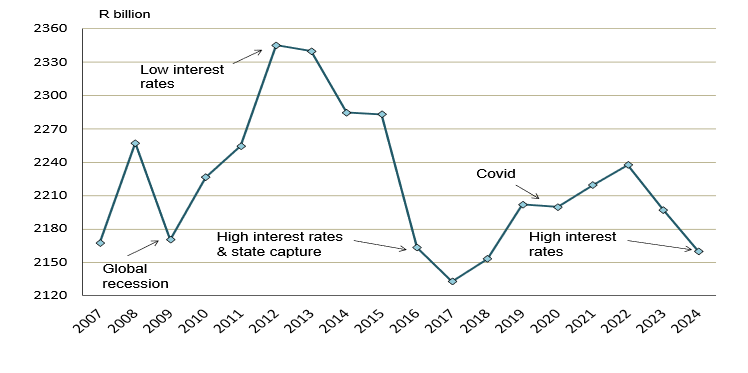
11 CAPITAL FORMATION REMAINS IN
DECLINE
In the case of South Africa, determining the impact of high interest rates on fixed capital formation has been clouded by public sector incompetence stemming from the ANC’s policy of cadre deployment and a decade of state capture, during which large scale corruption, nepotism and fraud have led to the decay of much of the country’s infrastructure, especially in transport logistics and energy.
The lack of sufficient investment in new productive capacity in South African represents one of the most pressing constraints on the economy’s current and future growth potential, as capital formation is subject to lengthy time-frames before new factories, roads and mines start contributing to higher output levels.
It is a serious indictment of South Africa’s macroeconomic policy since 2011 that capital formation has been neglected to the extent that it comprised less than 15% of GDP in 2024. This is less than half of the ratio that existed in India and South Korea and 55% lower than the global average of 25.9% (see figure 34).
Figure 34: Gross fixed capital formation as % of GDP - selected countries (2024)

(Source: World Bank)
The exceptionally high level of interest rates that have existed since 2022 have undoubtedly served as a major deterrent to new investment in capital formation. Although the private sector has managed to buck the general downward trend for most of the post 2010-period, the recent rise of South Africa’s benchmark commercial lending rate to its highest level in 15 years has finally put paid to this resilience.
Between 2007 and 2009, exceptionally strong growth occurred in this key indicator of current and future economic growth potential as a result, inter alia, an expansion of the road network in Gauteng, preparations for the hosting of the 2010 FIFA Soccer World Cup and progress with the so-called RDP housing program in low-income areas. In line with most countries in the world, capital formation took a knock during the 2008/09 financial crisis, triggered by inadequate financial sector regulations and oversight in the US and Europe.
Following a recession that only lasted for three quarters, capital formation was up and running again, due, inter alia, by the adoption of an accommodating monetary policy approach by the previous Governor of the SA Reserve Bank, Gill Marcus. During her five-year term of office, the average real prime rate was 3.4% and was accompanied by average annual real GDP growth of 2.6%.
Since the adoption of an excessively restrictive monetary policy stance by the MPC in 2022, the average real prime rate has increased by 87% over the average that existed during the tenure of the previous governor of the Reserve Bank, whilst average annual real GDP growth has shrunk by 70% to an annual average of less than one per cent.
During the third quarter of 2025, South Africa’s real benchmark commercial lending rate was more than 100% higher than the norm that existed between 2011 and 2015. It borders on the incomprehensible that a developing country with an unemployment rate of close to 50% can experience such a dramatic shift in its monetary policy approach, especially against the background of the decimation of demand that occurred as a result of the Covid-19 pandemic.
Figure 35 tells a woeful tale of the collapse of new investment in South Africa’s infrastructure by state-owned enterprises (SoEs) over the past decade, a trend that filtered down to lower levels of capital formation in the private sector and that has resumed a downward trajectory as a result of the record high cost of capital and credit in the country.
Figure 35: Gross fixed capital formation by public corporations at constant 2024 prices

(Source: Stats SA)
The demise has been caused by a combination of the following:
The appointment of a new monetary policy committee by former pres. Jacob Zuma in 2015, which systematically started to change course to a more restrictive monetary policy, raising the real prime rate from an average of 3.1% in 2014 to an average of 5.1% in 2017; 6% in 2019 and 8.3% in March 2025. The relentless rise in the real prime rate was halted temporarily by the sharp economic contraction imposed by the Covid-19 lockdowns, but was then resumed, with the real prime rate standing at 7.1% as at the end of July 2025 (following five welcome, but insufficient repo rate cuts of 25 basis points each). Since the retirement of Gill Marcus, the real cost of capital investment remains more than 100% higher, which explains, to a large extent, the current downward trend in real private sector capital formation.
Figure 36: Average annual real % change in fixed capital formation by sector (2011 to 2024)

(Sources: Stats SA; own calculations)
Ever since 2015, it became obvious that South Africa’s SoEs, most notably Eskom and Transnet, had become riddled with corruption and incompetence, ultimately leading to extensive rationing of electricity, disruption of railway lines and severe constraints at most harbours. The financial mismanagement that accompanied state capture eventually also restricted the future ability to revive expenditure on infrastructure maintenance and expansion.
Since 2020, financial and fiscal constraints imposed by the Covid-19 pandemic have thwarted any meaningful recovery in capital formation trends. Although a marginal upward trajectory occurred in 2023, record high interest rates stopped this recovery in its tracks.
Only two sectors of the economy, viz. trade & hospitality and agriculture, have managed to meaningfully increase real investment in new productive facilities since 2011, as illustrated by figure 36.
It is important to note that when the cost of investing in new productive capacity becomes too high, it acts as an effective tax on venture capital, due to the ease with which revenue can be earned by rather investing surplus funds (that could have been earmarked for the expansion of productive capacity) into financial instruments such as money market accounts.
12 INSUFFICIENT DEMAND
The repo rate increases that commenced in October 2021 eventually led to an increase in the real prime rate three years later of 335%. Although the repo rate has since been lowered, the real prime rate remained 130% higher in October 2025 than the average for 2014. Between 2011 and 2014, the average real prime rate was 3.4% and real GDP growth was 2.4%. At the end of 2024, the real prime rate was 485 basis points higher at 8.25% and GDP growth was 0.5% - less than a quarter than the rate recorded between 2011 and 2014. The unwarranted three-fold increase in annual average real lending rates between 2021 and 2025 has exerted a profound stifling effect on household consumption expenditure and new investment in productive capacity by the private sector, which are the main engines for demand-led economic growth in South Africa.
It is also strange that the Governor of the Reserve Bank recently alluded to a neutral impact on aggregate demand as a result of the restrictive monetary policy that has lasted for more than three years. This is not true from the perspective of per capita household expenditure in real terms, and it is also a fallacious statement from the perspective of the other key component of expenditure on GDP, namely capital formation. Between the first quarter of 2022 (just after the switch to a restrictive policy stance) and the first quarter of 2025, capital formation declined by an average rate of 0.6% per annum in real terms.
Over the past two years, the value of demand in the South African economy has declined in real per capita terms. In analysing the recent decline in South Africa’s consumer price index, Brian Kantor (2025) posits that the reason for this welcome relief from rising prices is mainly related to the very slow growth of demand for goods and services (due to highly restrictive monetary policy), combined with price stability on the supply side of the economy (due to currency strength).
He also points out that the growth in the money supply and bank credit, which influence spending in a direct way, has remained highly restrained for an extended period - going back to 2016. Over the past decade, bank credit (accounting for a large majority of the asset side of the banks’ balance sheets) has only grown by marginally more than inflation, in line with the slow rates of growth of output (GDP) and national incomes.
Money and credit growth picked up in 2022-23 as commodity and metal prices recovered but both have declined consistently since then. Real bank lending to the private sector is below pre-Covid levels as is GDP. Given such financial repression, any upward pressure on prices from extra spending (the demand side of the price equation), was not possible. As evidenced by the paltry average annual real growth in GDE of less than 0.5 per cent between the fourth quarter of 2022 and the first quarter of 2025.
Figure 37 illustrates the declining momentum for gross domestic expenditure since 2023, turning into a negative trend line (polynomial) in 2024, as the real prime rate continued to increase relentlessly since 2022. This ultimately inverse relationship is in line with what happened to South Africa’s GDP growth rate since the decision by the MPC to raise the benchmark lending rate to its highest level in 15 years (in real terms). As pointed out by Kantor (2025), when real demand grows very slowly as it has in South Africa, real income growth cannot advance at a much faster rate, regardless of what may well have been faster potential growth in the absence of an austere monetary policy setting. Monetary policy must be judged as highly restrictive, due to the fact that real interest rates have increased quite dramatically since 2015, despite an absence of demand-side inflation.
Figure 37: Trend lines for real gross domestic expenditure (GDE) and the real prime rate

(Note: 2-period mov. avg)
(Sources: Stats SA; own calculations)
The Reserve Bank does not target money supply or credit growth rates. The instrument of policy is its interest rate settings, which were hiked sharply in response to higher inflation after the Covid-19 pandemic, caused by supply side shocks to prices, especially the oil price and record increases in global freight shipping rates, as well as a weaker rand. Clearly borrowing from the banks to fund working capital or a mortgage on a home loan has been strongly discouraged by the high real costs of or rewards for money and credit.
In the absence of significantly lower interest rates to encourage the growth in demand for bank credit and spending by households and firms, Kantor (2025) believes that GDE will not be able to grow beyond forecasted GDP growth rates of less than 2% p.a. Furthermore, too little rather than too much spending (relative to potential supplies of goods and services) will continue to weigh heavily on the pricing power of domestic producers. The Reserve Bank has predictably increased interest rates, despite the pressure on prices almost always emanating from the supply side – from external price shocks and exchange rate weakness.
Against this background, Kantor (2025) recommends that temporary supply shocks on the price level should be ignored by monetary policy. Judged by past performance the danger to the economy of another supply-side shock will be policy determined interest rates that are too high rather than too low for the good of the economy. It is to an improved supply side of the economy that the economic policy-makers should look for pursuing permanently low inflation. The danger of demand-led inflation is a small one.
13 SHARP DECLINE IN HOUSEHOLD
CREDIT EXTENSION
Household credit growth in emerging market countries and its impact on economic welfare has been thoroughly analysed and discussed by academics and international research institutions, including the IMF. In its 2006 Global Financial Stability Report, the IMF’s Monetary and Capital Markets Department concluded that the welfare gains from expanding household credit extension can be sizable, making further growth of household credit desirable. This occurs via the channels of reducing household consumption volatility, improving investment opportunities, easing the constraints on small and family businesses, and diversifying household and financial sector assets.
Care should nevertheless be taken to prevent the unbridled acceleration of household credit extension, especially due to the possibility of systemic rise in non-performing loans and where the regulatory authorities are constrained by limited skills and inadequate financial sector development. Fortunately, these concerns do not exist within the South African financial services sector.
It is clear from table 2 that South Africa’s ratio of domestic credit extension to GDP is low by international standards.
Table 2: Domestic credit to the private sector as & of GDP - selected countries & regions (2024)

(Source: IMF)
According to the IMF, four key areas need to be present in order to prevent a buildup of vulnerabilities with regard to excessive credit extension. These are:
Prudent macroeconomic management to minimize income, exchange rate, and interest rate shocks.
Introducing sound prudential norms for household credit and encouraging good origination standards and information sharing by banks.
The presence of a comprehensive legal and regulatory framework.
The availability of information that enables better assessment of systemic risks and their mitigation.
All of the above conditions are present in South Africa. Unfortunately, however, the positive impact of increasing levels of household credit extension on private consumption expenditure and capital formation has been thwarted by the higher interest rates that kicked in from 2015 onwards and then rose to a 15-year high in May 2023, where it stayed for 16 successive months, as aptly illustrated by figure 38.
The inverse correlation between the rising cost of credit and the ratio of household credit extension to GDP is confirmed by the trend lines depicted in figure 39.
Figure 38: Household credit extension at constant 2024 prices
(Source: SARB – deflated by the CPI)
Figure 39: Trend lines for household credit/GDP ratio and the average prime rate (polynomial)

(Source: Stats SA; SARB)
14 LOWER PER CAPITA DISPOSABLE
INCOMES
The disposable incomes of South African households (in real terms) have declined consistently over the past decade, with a more pronounced downward trend line since the restrictive monetary policy started to take its toll on virtually all of the key macroeconomic indicators, as illustrated by figure 40.
The latter represents the dominant driver of aggregate demand in the economy and, as an inference, GDP growth. In 2021, on the back of a nominal prime rate that was 400 basis points lower than currently, the country’s real annual per capita disposable income recovered to within a whisker of the level immediately prior to the Covid lockdowns. Since then, it has declined by more than 2.6% to just above R74,000, compared to more than R78,000 when Gill Marcus was in charge of monetary policy.
Any doubt over the negative impact that high interest rates have exerted on the South African economy is dispelled by the downward trend in the ability of households to earn and generate sufficient disposable incomes to maintain their standard of living. The consistent erosion of the financial disposition of South African households since the new monetary policy regime took over in 2015 should be a point of huge concern to the government, as this issue was in all likelihood at play during the national elections of 2024.
Figure 40: Per capita disposable income of households at constant 2024 prices

(Sources: SARB; own calculations)
15 NEGLECT OF THE OBJECTIVES OF
GROWTH AND JOB CREATION
The primary goal of the South African Reserve Bank (SARB) is the achievement and maintenance of price stability, in the interest of balanced and sustainable economic growth, which is in line with the policy mission statements of most other central banks. Interestingly, several central banks in developing countries also specifically mention the objective of implementing policy in the interest of economic development, which is aligned to the quest for sufficient employment creation.
In an illuminating article on the inappropriate nature of monetary policy since the end of 2022, Barr and Kantor (2023), refer to the argument of the Reserve Bank governor (in defending a series of interest rate hikes) that it may have a negative impact on the growth rate of the economy in the short term, but in the longer term these actions will lead to low and stable inflation rates.
They proceed to point out that this theory of monetary policy is not particularly applicable to the South African case. South Africa is a small economy and open to foreign trade and capital flows. This means the foreign exchange value of the rand, which is a primary driver of the inflation rate, can change abruptly for reasons that have little to do with interest rate settings, the actions or beliefs of the central bank, or expectations of its actions.
With reference to an infamous piece of South African economic history, Barr and Kantor remind their readers of the actions of Chris Stals, the Bank’s governor during the emerging market crisis of 1998, who repeatedly raised the repo rate in an attempt to reverse a sharply weakening rand. By mid-1998, the repo rate was at a record 22%, resulting in the commercial bank prime overdraft rate rising to 25.5%. This ill-considered move to defend a falling rand cost the country $20bn in lost foreign exchange reserves and ended in failure. The South African economy has not changed fundamentally in the past 25 years. It remains a small, open, commodity-exporting economy subject to supply-side shocks from the outside world, including the commodity price cycle, wars and other major world events that are beyond our control.
However, the governor still seems to disregard these lessons of history. He should realise that the behaviour of the rand is the primary determinant of the inflation rate, but that he has little power to positively influence its value in any easily predictable way.
With reference to the hike of 50 basis points in the repo rate on 25 May 2023, Barr and Kantor pointed out the reasons for the plunge in the value of the rand that occurred immediately after the rate announcement, namely:
An imminent weakening of gross domestic expenditure levels
An increase in sovereign risk because external perceptions of South African growth deteriorate further
Government, which is dependent on the PAYE and value added tax receipts collected from formal sector employees and private sector enterprises, is put under further fiscal pressure
By raising the interest rate by 50 basis points at the time, the central bank had done little except inflict damage on an already weak South African economy. Restrictive monetary policy has clearly hurt, not helped, the exchange value of the rand by directly depressing any growth prospects for the economy, achieving precisely the opposite of what one assumes the central bank intended. Barr and Kantor also specifically allude to the constitutional mandate of the Reserve Bank to conduct policy in the interests of balanced and sustainable economic growth. What’s more, the Bank also has a constitutional obligation to enhance and protect financial stability. It is hard to see how that imperative is concordant with inflicting financial pain on South African households and firms in the form of higher interest rates. They conclude by stating that, in fact, the threat of serious domestic instability through low growth and high unemployment is both real and dangerous.
Over the past decade, it has become apparent that the SARB’s policy focus has been concentrated on the lowering of inflation, with a disregard for the second element, namely economic growth (and, as an inference, employment creation). This is confirmed by the structural shift towards a higher lending rate, also in real terms. The balance between keeping inflation to within reasonable parameters and ensuring adequate economic growth and employment creation seems to have disappeared, as discussed in some detail in the sub-sections above.
Figure 41: Logarithmic trend lines for the real prime rate and the formal employment coefficient

(Sources: Stats SA; SARB; own calculations)
Over the past three years, monetary policy has hurt the economy’s ability to create meaningful employment via an overly restrictive policy stance and a consistent raising of the real interest rate. This is illustrated by figure 41, which presents contrasting patterns for the logarithmic trend lines of the formal employment coefficient and the real prime lending rate (which is directly determined by changes to the repo rate).
Figure 42 confirms the inverse correlation between the real prime rate and the year-on-year rate of change in private sector employment. The latter represents one of the mainstays of macroeconomic stability, as remuneration in the private sector, unlike the public sector, is intrinsically linked to value added and also supports the bulk of government’s taxation revenue base (directly and indirectly).
Figure 42: Real prime rate and YoY % change in private sector employment

(Sources: Stats SA; SARB)
The decline in both the rate of private sector job creation and the formal employment coefficient (the change in employment growth divided by the change in economic growth – Hodge 2009) is especially alarming and should be regarded as a serious threat, not only to fiscal and economic stability but also to socio-political stability in South Africa.
Figure 43: Formal employment and total unemployment (broad definition)

(Source: Stats SA)
The consistent and sharp increase in total unemployment in South Africa (broad definition, which includes discouraged work-seekers) is equally alarming, with this figure of just over 11.5 million people now equal to the level of formal employment (see figure 43). In 2015, there were 3.2 million more people employed in the formal sectors of the economy than the total number of unemployed people. Unless this trend is reversed soon, the majority of the country’s labour force will not have a decent job and will not contribute to the most important source of government revenue, namely personal income tax.
Figure 44: Unemployment rates - selected emerging markets, developing economies & G7 average

(Sources: World Bank; Stats SA)
The inability of the economy to create formal sector jobs at a pace commensurate with population growth is a point of huge concern. At the end of 2015, just before the shift towards a significantly more restrictive monetary policy stance started to occur, a total of 31% of South Africa’s working age population enjoyed formal sector jobs. This ratio has now shrunk to only 27%.
In both the US and Europe, the rise in price levels due to the disruption of the Covid-19 pandemic went hand in hand with a consistently low level of unemployment – a luxury that did not exist in several EMEs, most notably in South Africa, which has been battling with an unemployment rate of above 30% for decades. South Africa has the highest unemployment rate (narrow definition) in the world amongst a peer group of EMDEs, as illustrated by figure 44.
The extent of the excessive high rate of joblessness is especially concerning, a view that has been echoed by the World Bank report on an appropriate economic policy reform agenda (2025), which was prepared at the request of the South African government.
Although it is well documented that the excessive burden and growing incompetence of public sector institutions, over-regulation of the economy in general, and the damage inflicted on South Africa’s infrastructure during the state capture era have prevented the economy from realising its growth potential, the MPC’s restrictive monetary policy has added to these woes.
The World Bank report, titled Driving inclusive growth in South Africa, identifies a number of priority areas for feasible, impactful and timely policy actions to correct the country’s growth trajectory. Two of these that could be greatly enhanced by a redirection of monetary policy towards targeting a real prime rate of below 4%, are:
Redirect public spending toward capital investment and job creation
Unleash the potential of small and innovative firms through venture capital
The former of these two actions can only be successful with the maximum involvement of the private sector, especially in the areas of construction and transport logistics, which require substantial amounts of financial capital. Current commercial lending rates are not conducive to the attraction of such capital or to the venture capital requirements recommended in the second action.
A pronounced shift in the emphasis of monetary policy is urgently necessary, namely from targeting very low inflation to enabling private sector expansion, incentivising higher levels of demand and creating employment. This will require a flexible target range for the real prime rate of 3% to 4%, as was the de facto case between 2011 and 2015, when average annual real GDP growth of 2.6% was recorded.
Figure 45 provides a snapshot of the debilitating effects of unduly high interest rates on growth during four different periods before and after the Covid-19 pandemic, whilst figure 46 illustrates the dismal growth performance of South Africa, compared to high income countries and its peers in the upper middle-income countries.
Figure 45: Average real prime rate & average YoY real GDP growth since 2011

(Sources: Stats SA; SARB)
Figure 46: Post-Covid GDP growth rates for high income countries, South Africa & its EMDE peer group

(Sources: World Bank; Stats SA)
SECTION C
Modelling the impact of lower interest rates on the GDP
1 INTRODUCTION
Understanding the impact of interest rate changes on South Africa’s GDP is important for effective monetary policy. The South African Reserve Bank (SARB) uses interest rates as a primary tool to contain inflation and spur economic growth, but the relationship is complex with mediating factors such as household debt, investment, exchange rates and global shocks.
Empirical studies consistently find that increases in interest rates tend to reduce both nominal and real GDP (Aron & Muellbauer, 2000; Cheteni et al., 2025; Jordaan, 2013; Ntshuntsha & Scholars, 2021; Nxumalo et al., 2024; Petlele & Buthelezi, 2025).
A study in 2013 found that a 100 basis point increase in the nominal interest rate leads to a reduction of 0.54% in nominal GDP and 0.22% in real GDP after a three-quarter lag (Jordaan, 2013). Similarly studies found that there is a significant negative long-run relationship between the repo rate and GDP, though short-run effects have mixed results (Ntshuntsha & Scholars, 2021; Nxumalo et al., 2024; Petlele & Buthelezi, 2025).
Interest rates affect GDP through household consumption (especially income groups with more access to credit), private investment, and employment (Cheteni et al., 2025; Gumata & Ndou, 2021; Jordaan, 2013). Higher interest rates constrain demand for credit and negatively affect GDP (Cheteni et al., 2025; Nxumalo et al., 2024; Sibanda, 2012). The modelling approaches in literature studies employ macroeconomic models, social accounting matrices, ARDL, VECM, SVAR, and CGE models to estimate the effects of interest rate changes on GDP (Beyers et al., 2023, 2024; Jordaan, 2013; Ntshuntsha & Scholars, 2021; Petlele & Buthelezi, 2025)
2 DATA AND SAMPLE
The data for this study is sourced from the South African Reserve Bank (SARB) database. The sample data is from the first quarter of 1995 up to the first quarter of 2025. The forecast period is from first quarter of 2022 to first quarter of 2025. The dependent variable is the GDP at current prices (saar), and the independent variables are the prime rate and the total CPI.
3 METHOD AND ANALYSIS
A autoregressive distributed lag model (ARDL) was fitted as indicated below:


An ARDL model was fitted and after correcting for autocorrelation (no heteroscedasticity was present) with the Newey-West estimation, the final model was: ARDL (3,1,0). This indicates the dynamic structure of the specification of the model. The Variance inflation factor to detect multicollinearity was for both variables below 10 which indicates that multicollinearity is not a problem in the function.
Table 3: ARDL model results

The GDP lagged after 3 quarters is significant on the 95% confidence level (p=0.176), the CPI is significant after 1 quarter lag with p-value of 0.0502 and the prime rate at the current period is significant with a p-value of 0.0076. Both variables have a negative relationship with GDP (CPI after a lag).
The adjusted R-squared is 0.9989 which means these explanatory variables explain 99% of the variance in GDP and the F=statistics also confirm the joint significance of the explanatory variables.
The bounds test, indicate that cointegration exists between GDP, CPI and the prime rate – i.e. a long-run equilibrium relationship exists between the variables. The test statistic is F=16.86 which is higher than the bounds indicated in the table below (table 2). The short-term coefficient is negative and significant, showing adjustment to long run equilibrium after short term shocks. This adjustment will be slow (coefficient: -0.048).
Table 4: Bounds test critical values

4 ASSUMPTIONS AND FORECASTS
Substantial scholarly research has been conducted that confirms the negative impact on a country’s GDP of rising interest rates, as has been highlighted earlier and also in Sections A and B. The objective of the modelling exercise is to establish whether a scenario where monetary policy is less restrictive would generate higher economic growth or not. To this end the forecast prime rate remains fairly stable at around 7% until mid-2023 and then gradually increases to a level where the real prime rate approximates the level of around 6% that existed during 2019 (pre-Covid). The assumptions for the prime rate for this scenario are shown in the table below. It is assumed that CPI maintains the actual trend.
Table 5: Assumptions

During the initial six quarters, the assumptions for the prime rate have been informed by the realisation that the spike in the consumer price index that occurred from June 2022 onwards was caused almost exclusively by abnormal simultaneous increases in maritime shipping rates and oil prices. The latter experienced unheard-of increases of 700% and 400%, respectively, due to a combination of Covid-19 lockdowns, erratic harbour closures and the Russian military invasion of Ukraine, which led to sanctions on Russian oil sales.
Although there could be a hint of the wisdom of hindsight being applied, the choice of prime rate assumptions may be regarded as realistic from the perspective that supply-side shocks such as were experienced between 2021 and 2023 are always going to be followed swiftly by a normalisation of prices to previous levels. Another rationale for the initial downward trajectory of the prime rate forecasts is related to the obvious need that existed for softening the blow of the Covid-19 lockdowns. More than 1.9 million people lost their jobs between the fourth quarter of 2019 and the second quarter of 2020 (formal and informal sectors).
Furthermore, it should be noted that the average forecast for the real prime rate between the third quarter of 2023 and the first quarter of 2025 (the model’s end period) amounts to 3.8%, which is only 30 basis points lower than the actual average real prime rate between 2011 and the first quarter of 2023. Subsequent to the latter date, the sharp normalisation of the producer price index and the consumer price index seems to have caught the MPC by surprise, as the country’s real prime rate shot up to 8.8% in the fourth quarter of 2024 – its highest level in almost two decades. The excessively high cost of capital put paid to any hope of meaningful economic growth, with 2024 recording a 0.5% GDP growth rate.
It should also be pointed out that the average prime rate forecast (in real terms) for the period between the third quarter of 2023 and the first quarter of 2025 is 40 basis points higher than the average real prime rate between 2011 and the first quarter of 2015, when real GDP growth averaged between 2% and 3%.
The modelling results for the above scenario are depicted in figure 46 below along with the actual and forecast prime rates.
Figure 47: Modelling results for a real prime rate trajectory aligned to pre-2022 monetary policy

(Sources: Stats SA; SARB)
The table below shows that the GDP would have been higher in all quarters after the second quarter of 2022, ending with a level of 2.8% higher GDP than the actual for the first quarter of 2025. This translates into a value increase in GDP of R206.4 billion, which would have led to higher employment and increased fiscal revenues.
Table 6: Percentage difference between the actual annulised GDP and the forecast GDP


Feeling stuck in the same old gaming loop, I decided to shake things up and gave https://1win1.ng/ a shot just to see if it could actually pull me in. From the first few clicks, it wasn’t the big wins that hooked me but how clean and responsive everything felt — games load fast, switching between sections is seamless, and the layout keeps you focused without distractions. I started small, mixing live tables with medium-risk slots, and quickly noticed how pacing completely changes the vibe. The live games bring just enough adrenaline, while the slots keep things steady. What really clicked for me is that your mindset defines the experience: once you slow down and play deliberately, even ordinary rounds feel exciting,…